

RIVERBANKS ZOO & GARDEN MAPS
Digital Illustration, Layout Design
RIVERBANKS ZOO & GARDEN
Digital Illustration, Layout Design
RIVERBANKS ZOO & GARDEN
Digital Illustration & Layout Design
Background
Riverbanks Zoo and Garden is the premier zoo and botanical garden in Columbia, South Carolina and one of Columbia's most popular tourist attractions.
Brief
Design new maps (to be printed for handheld use) for both the zoo and garden areas of the park. New maps should be easy to update with new information as exhibit offerings change regularly. Buildings should be easily recognizable.
Goals
- Make a map that is easy to use and understand.
- Target children and families with design.
Challenges
- Figure out what style of map to create.
- Find out how to be able to get the correct angles of each component of the map.
- Figure out how to introduce changeable text.
Solutions
- Choose vibrant colors and illustration style fit for children and families.
- Use isometric illustration to give the illusion of a 3D map.
- Collect and find images of all angles including a bird's eye view angle of the park.
- Use those images to create a 3D model.
- Learn to build a 3D model in new software.
- Build base map components in Illustrator, bring components into Photoshop to add dimension, add text in InDesign for easy editing.
Process
Research > Scout & record > Create 3D model > Illustrate > Finalize
Background
Riverbanks Zoo and Garden is the premiere zoo and botanical garden in Columbia, South Carolina and one of Columbia's most popular tourist attractions.
Brief
Design new maps (to be printed for handheld use) for both the zoo and garden areas of the park. New maps should be easy to update with new information as exhibit offerings change regularly. Buildings should be easily recognizable.
Goals
- Make a map that is easy to use and understand.
- Target children and families with design.
Challenges
- Figure out what style of map to create.
- Find out how to be able to get the correct angles of each component of the map.
- Figure out how to introduce changeable text.
Solutions
- Choose vibrant colors and illustration style fit for children and families.
- Use isometric illustration to give the illusion of a 3D map.
- Collect and find images of all angles including a bird's eye view angle of the park.
- Use those images to create a 3D model.
- Learn to build a 3D model in new software.
Process
Research > Scout & record > Create 3D model > Illustrate > Finalize
1. Research
1. Research
Collect ideas and inspiration for maps.
At the start, I asked myself the following questions:
- What styles of maps are there?
- What would work best for the zoo?
I paid the most attention to maps for park attractions (water parks, theme parks, other zoos). For the most part, these maps had isometric design, meaning they tricked the eye into looking 3D, a style that has long been used in video game art. I thought that would translate really well for a zoo map because this particular style communicates fun and adventure.
2. Scout & Record
2. Scout & Record
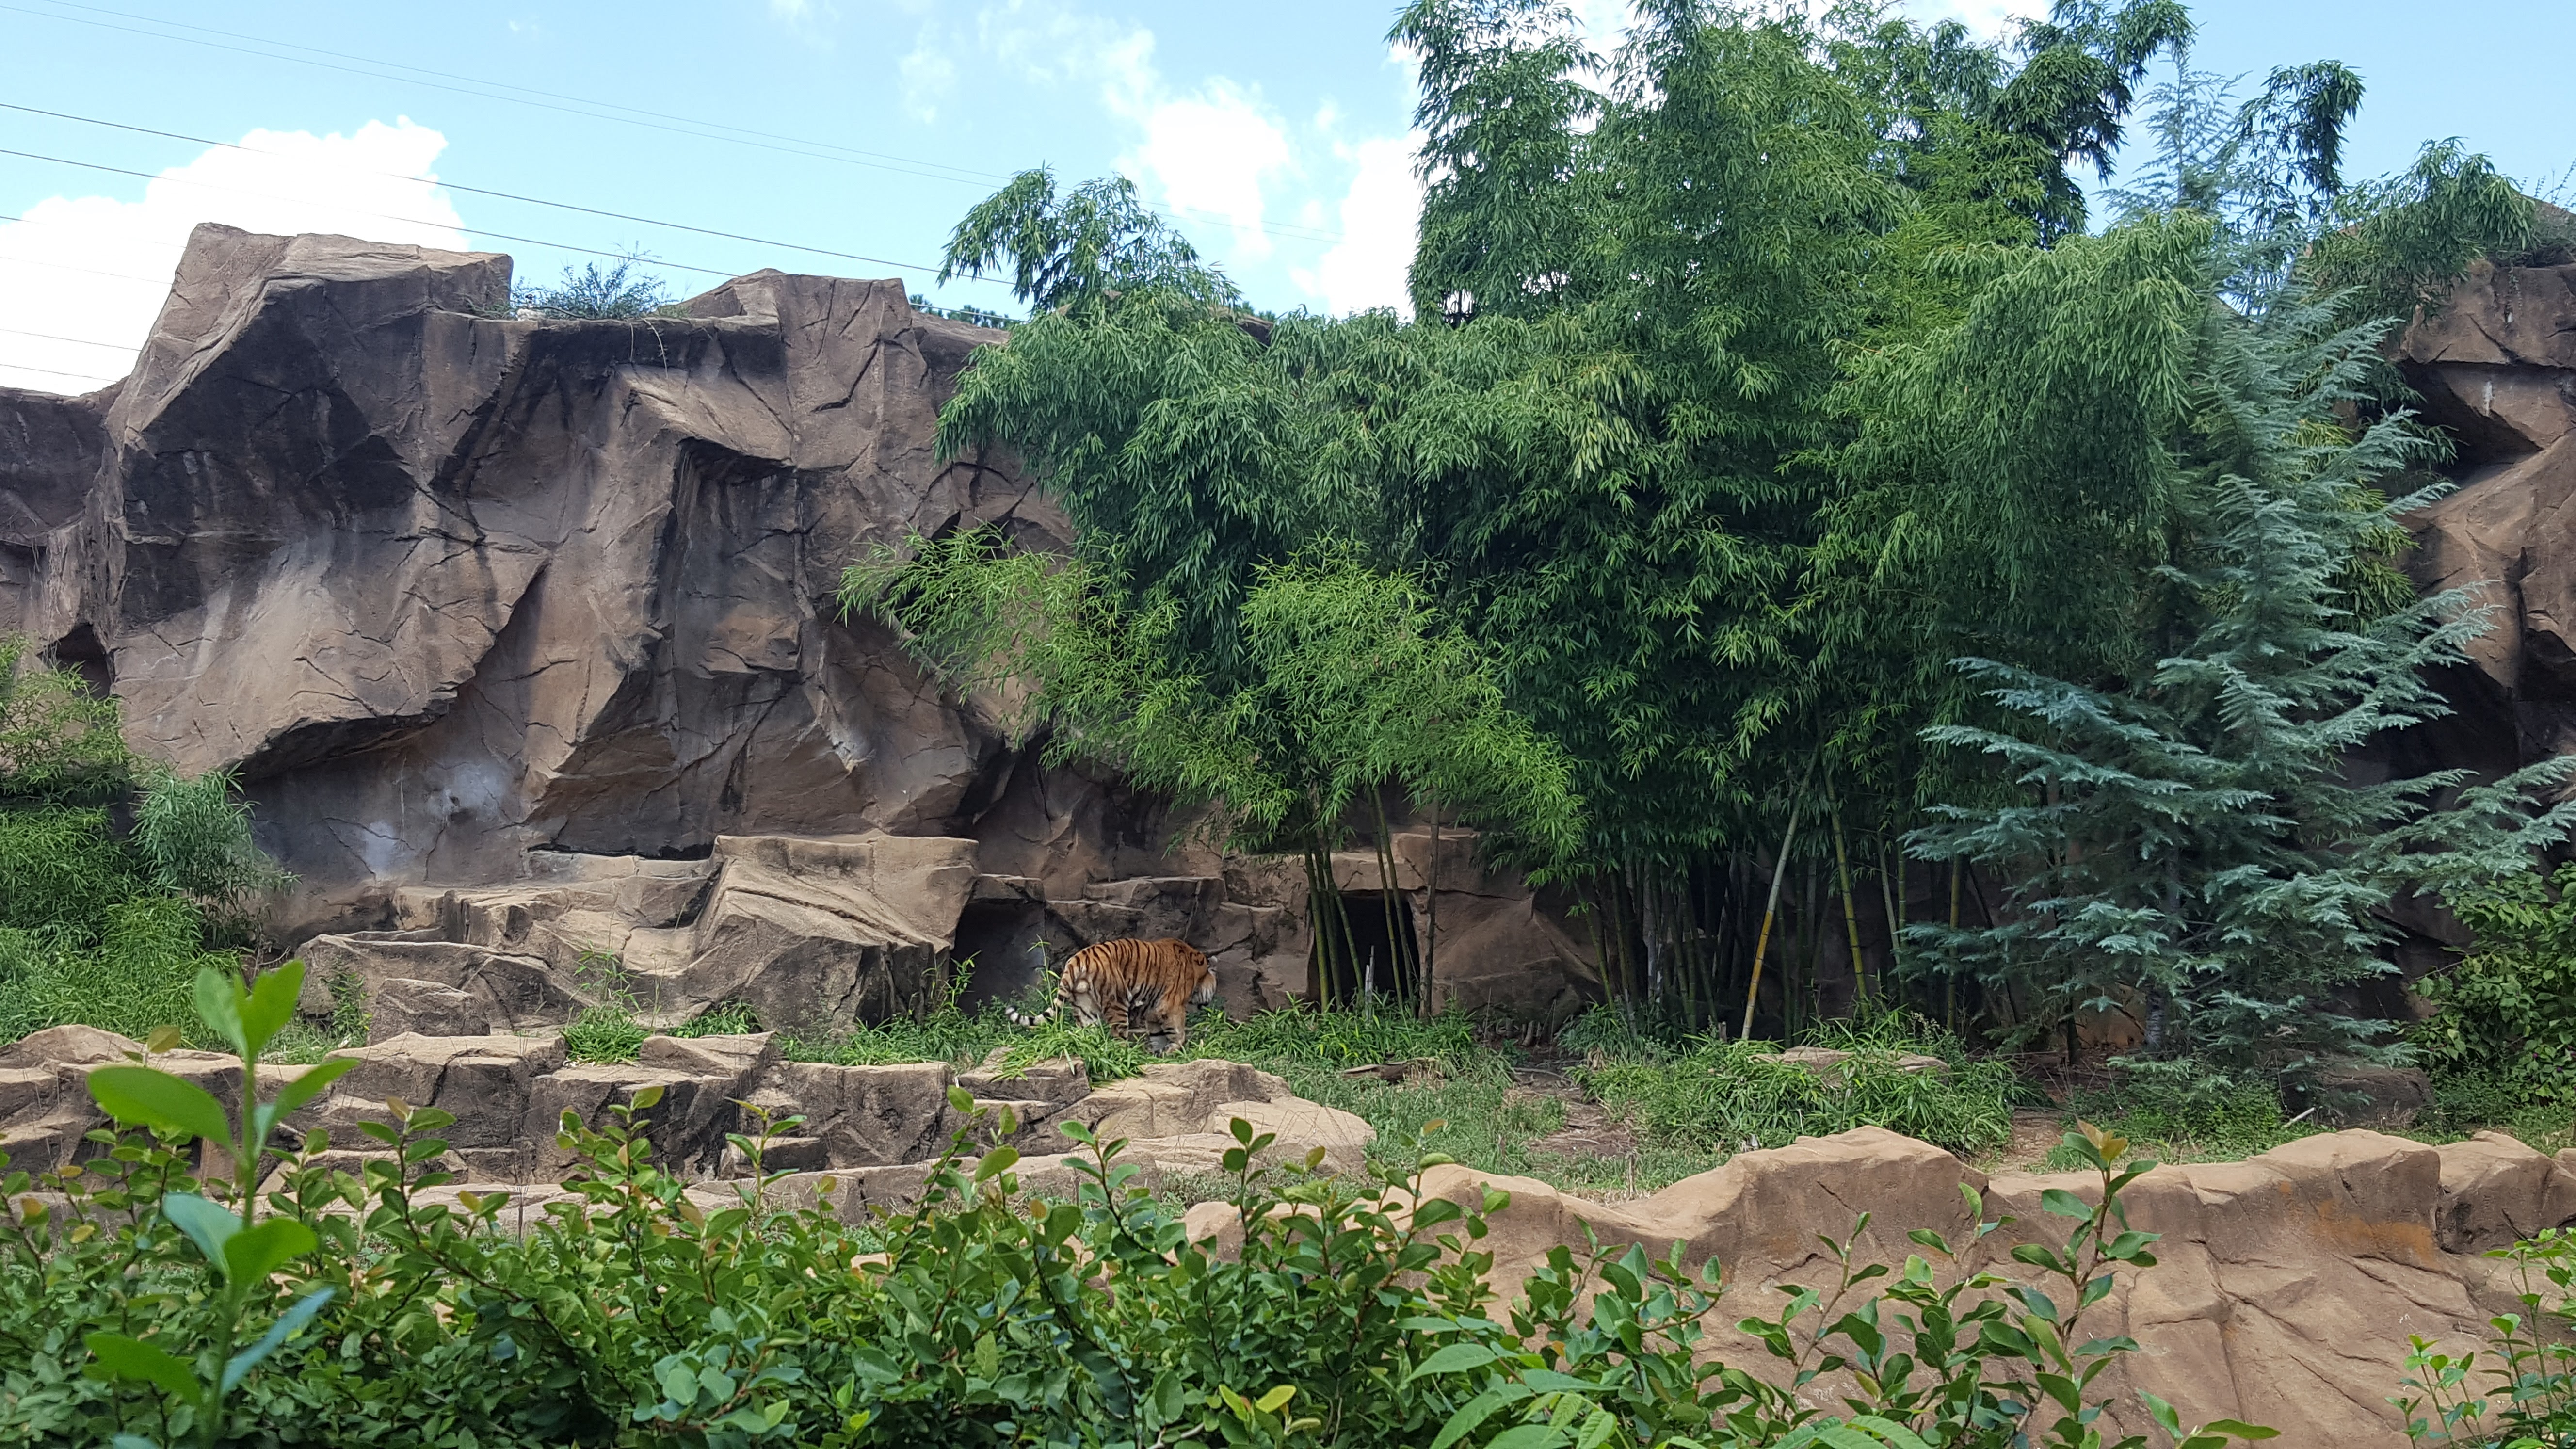
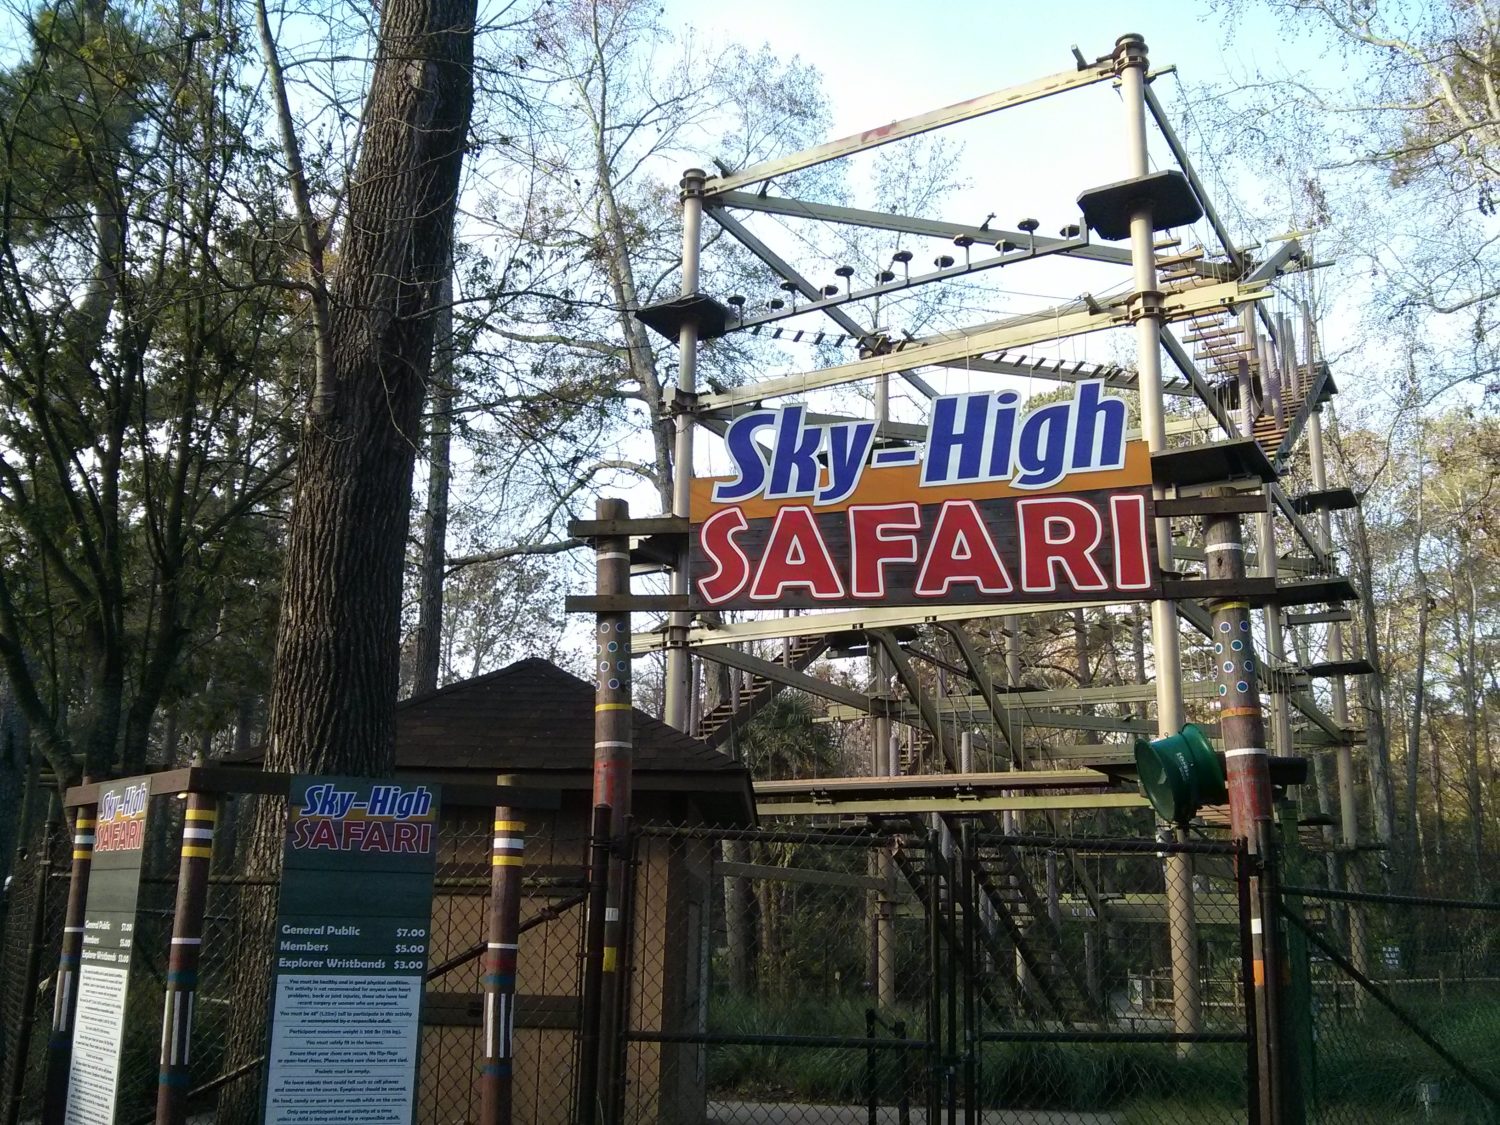
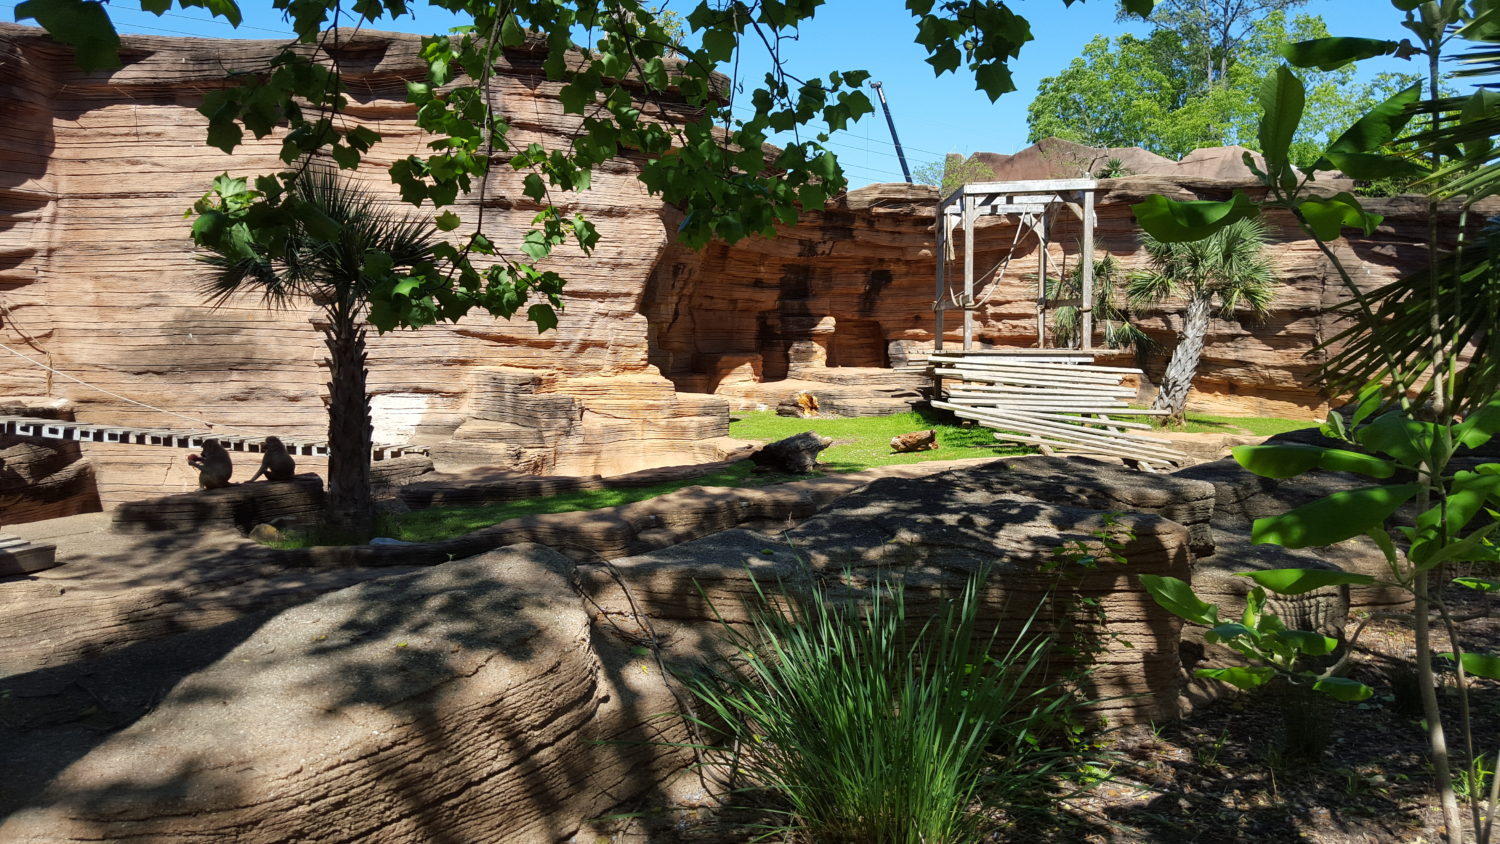
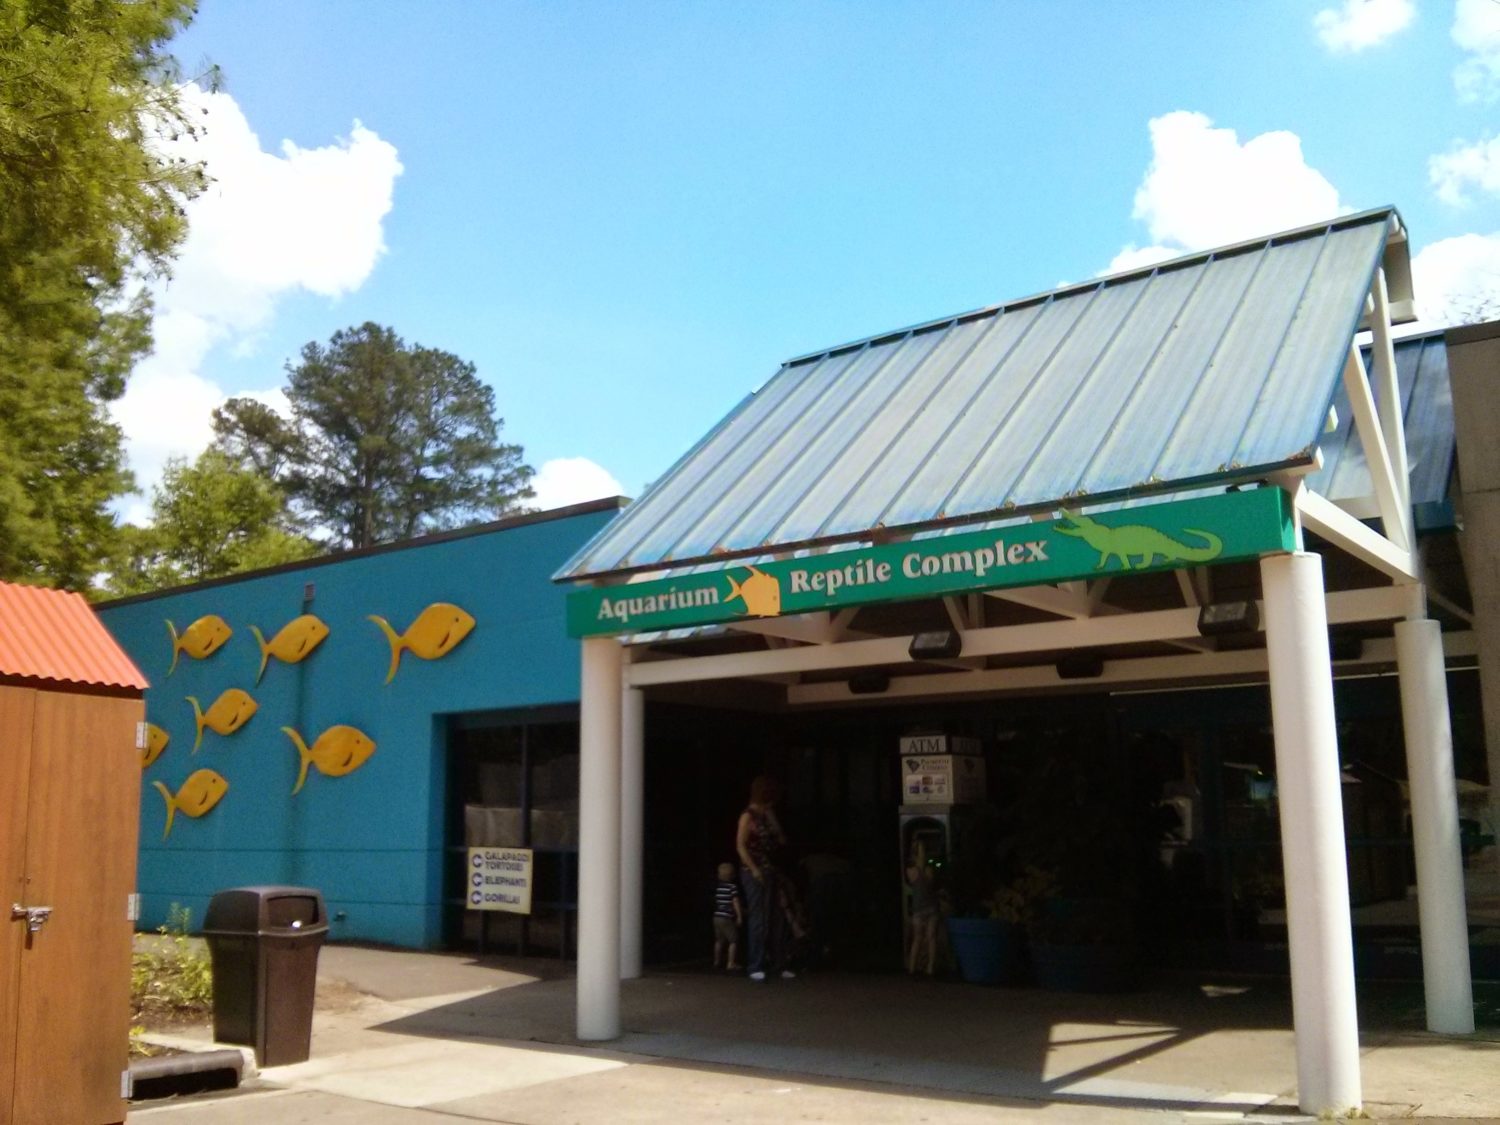
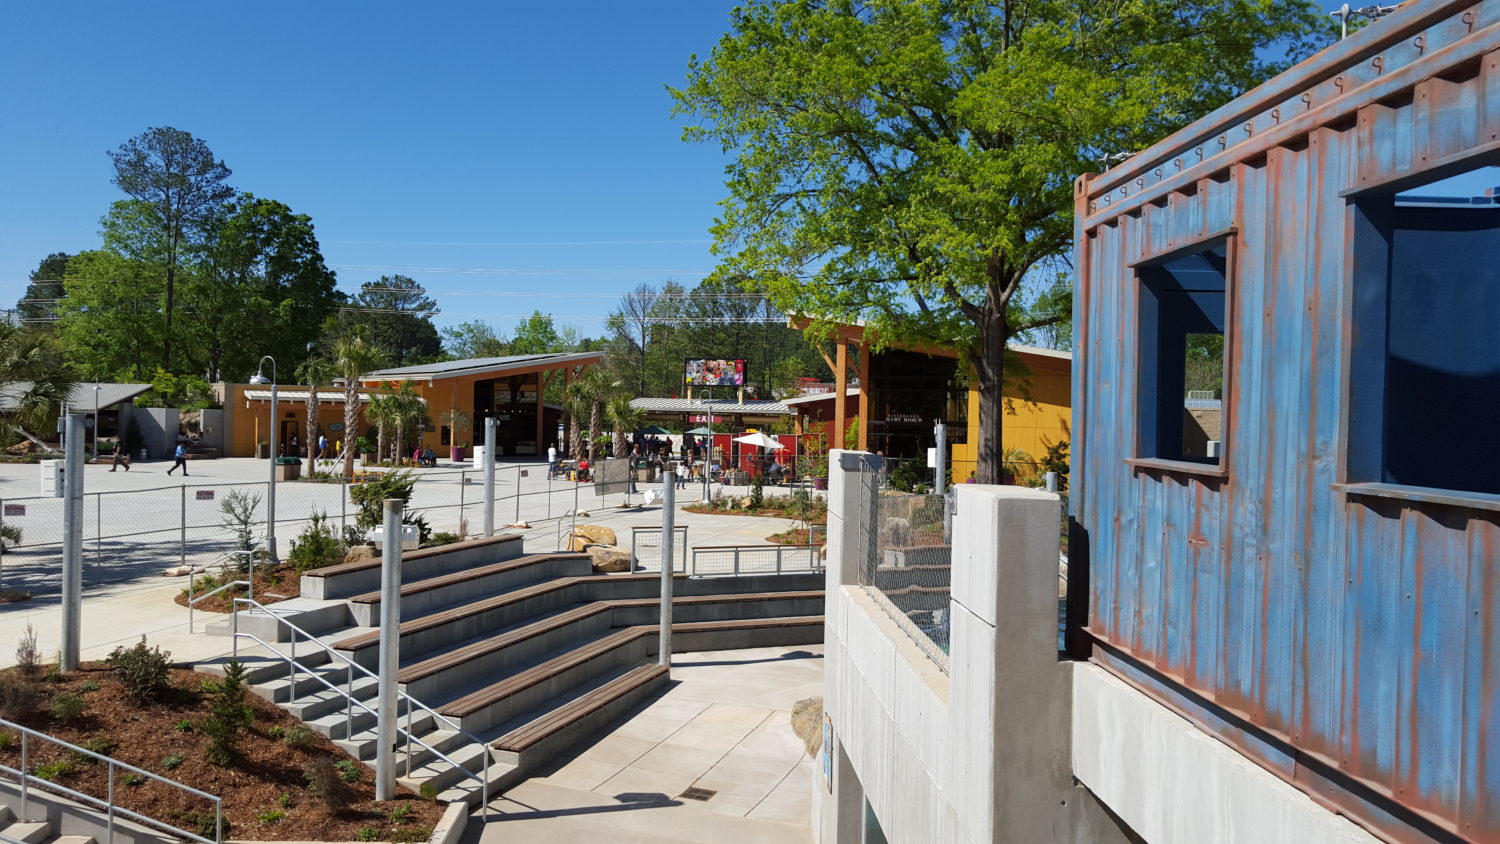
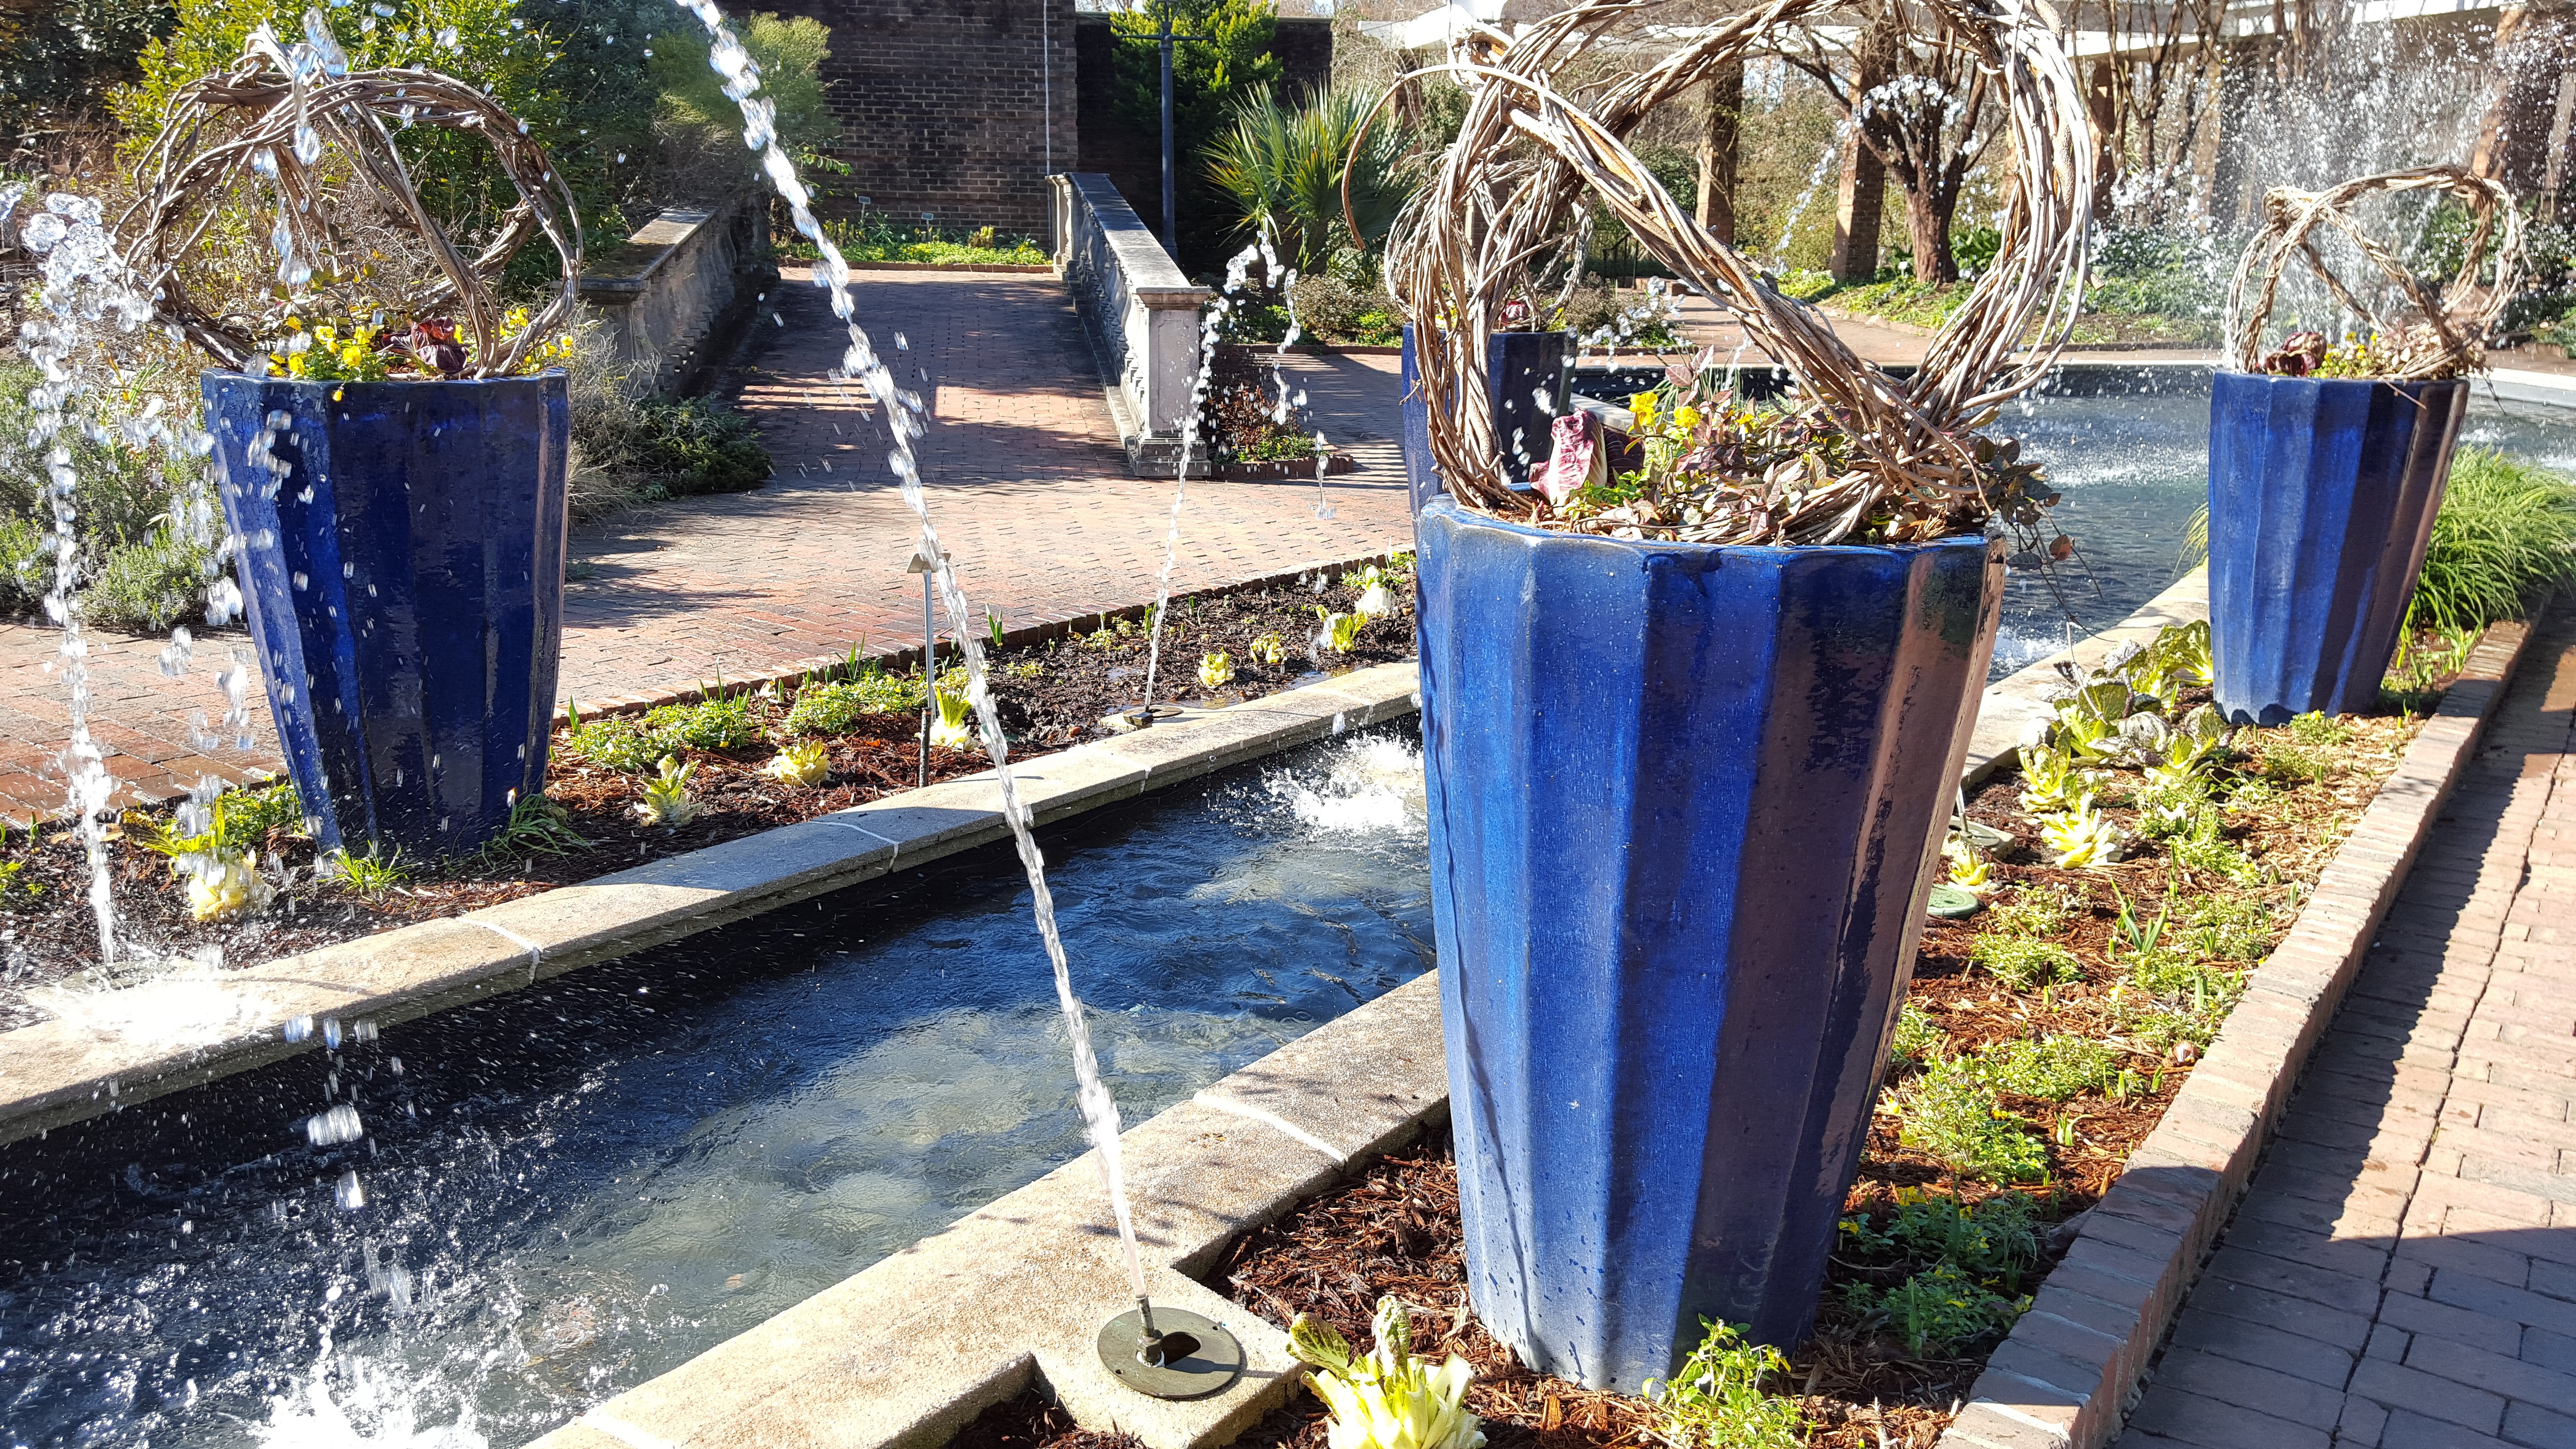
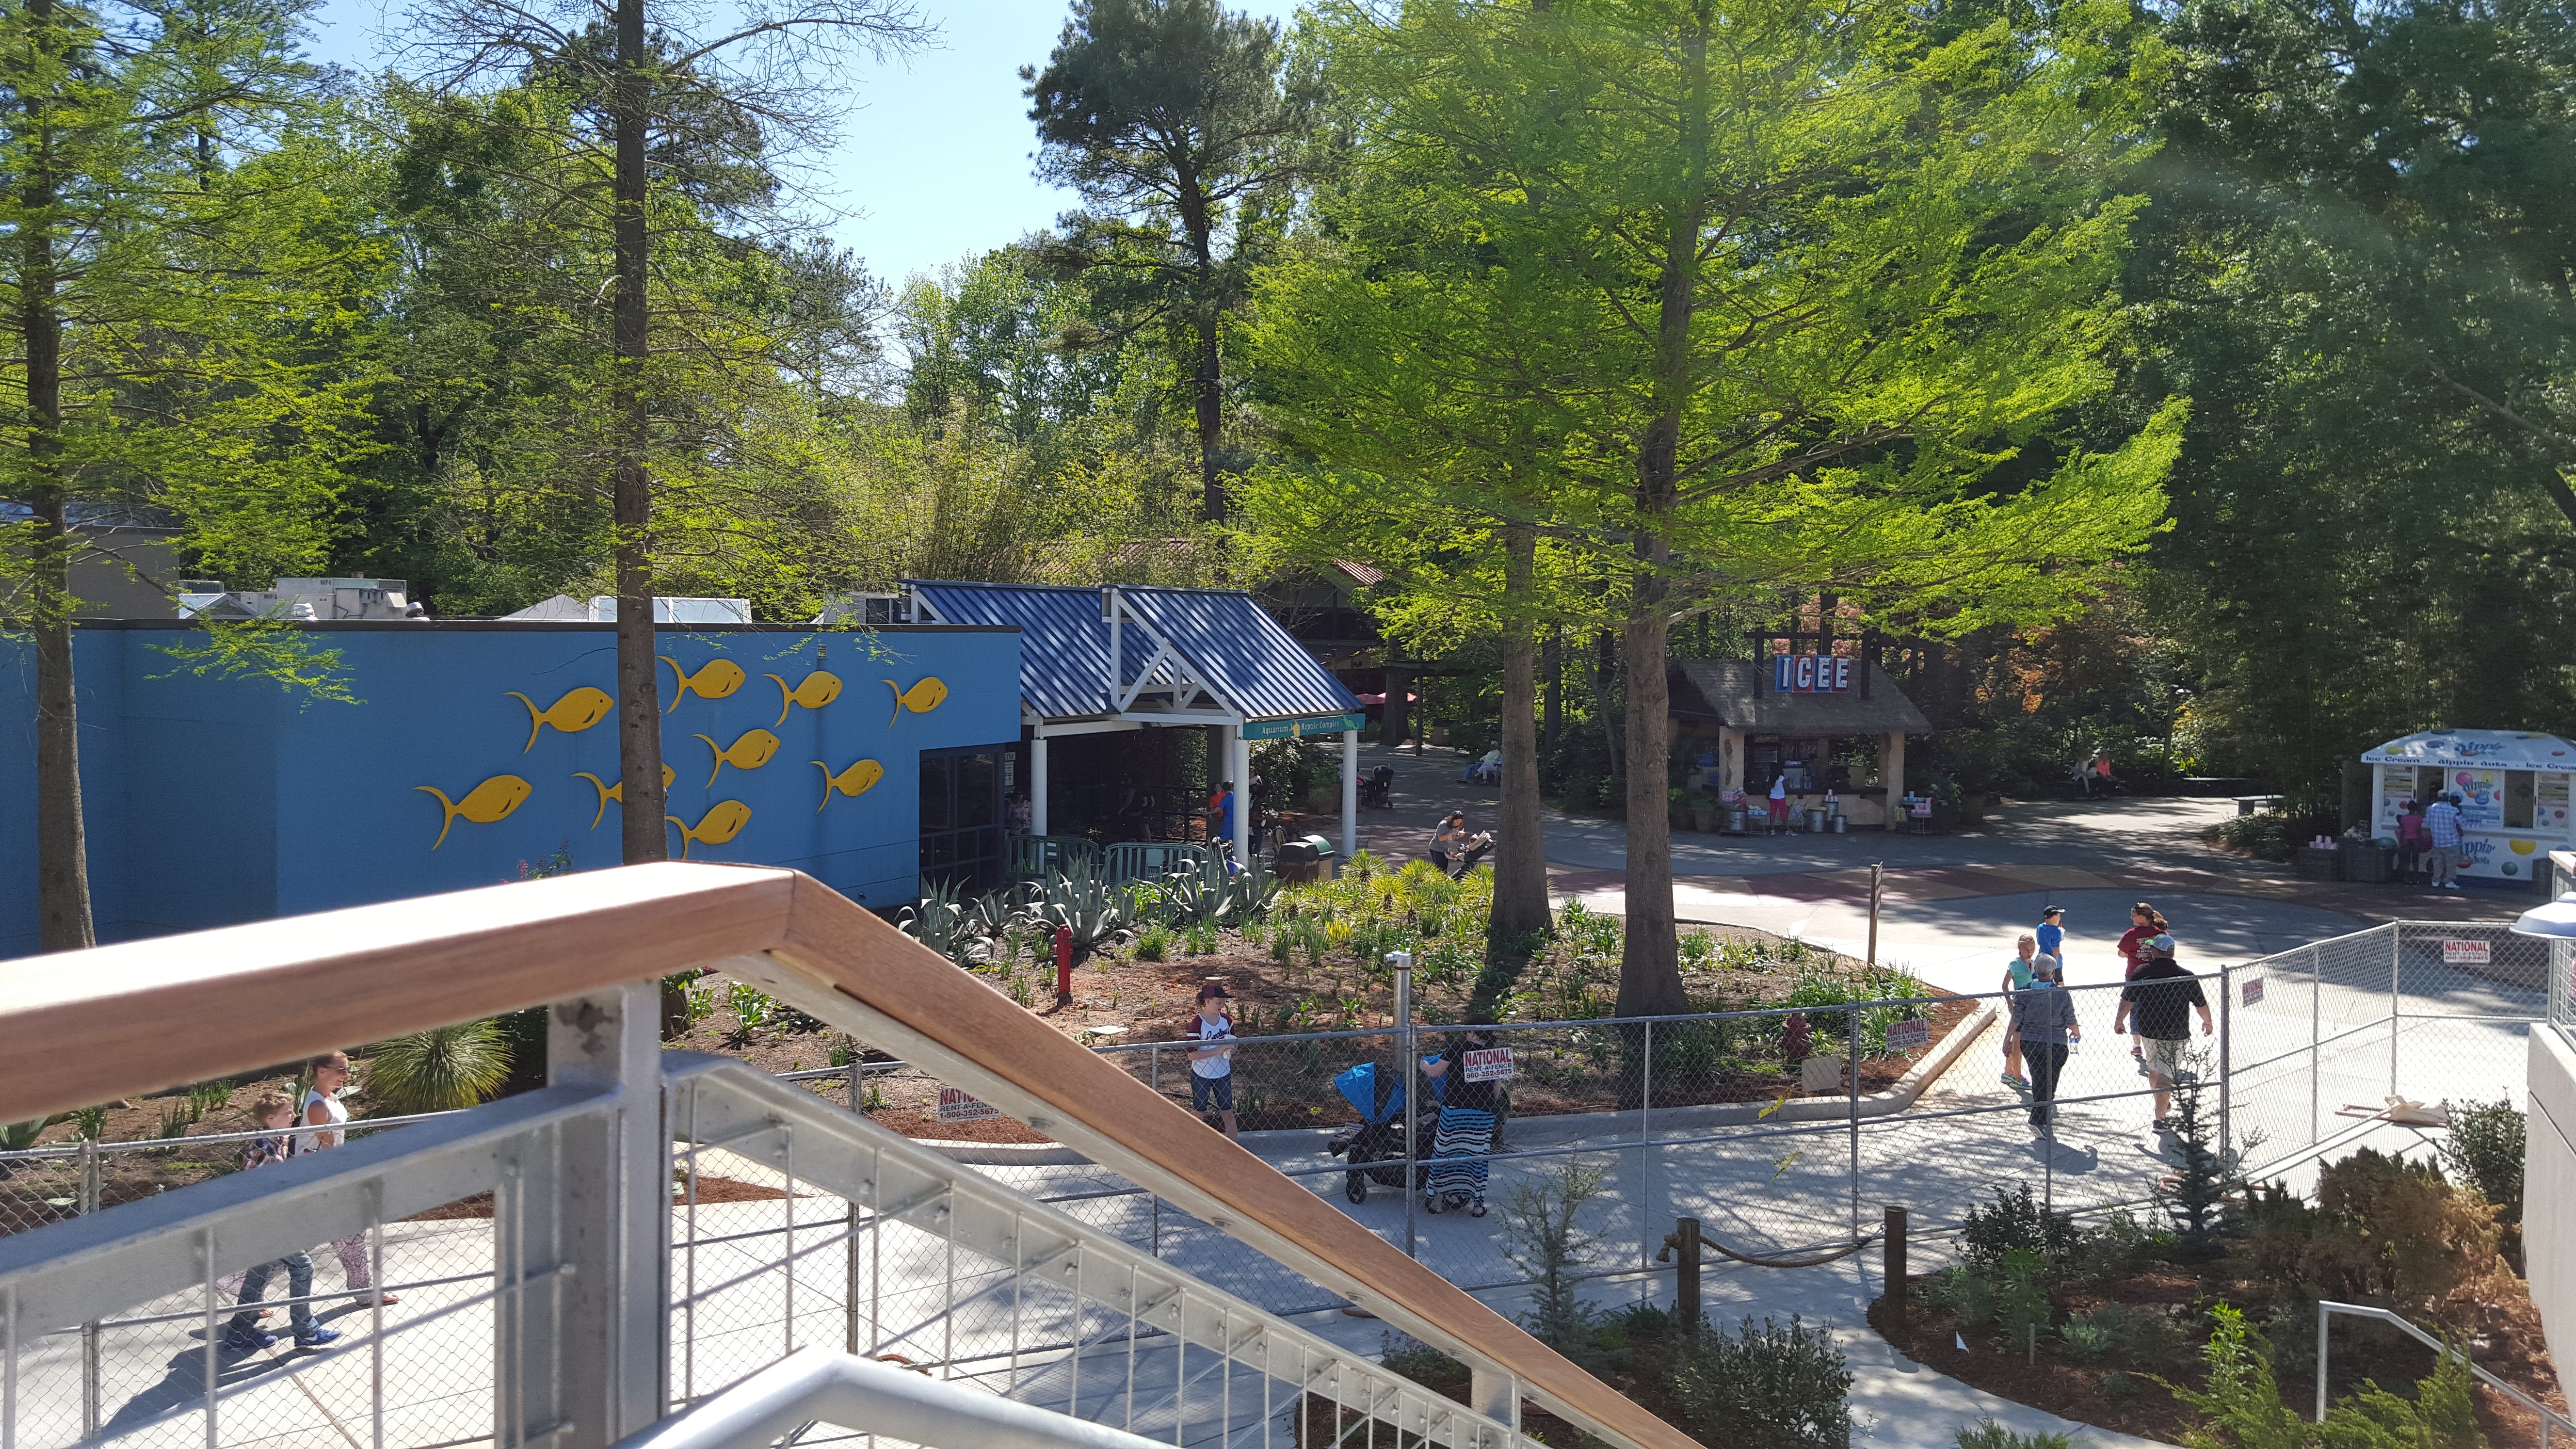
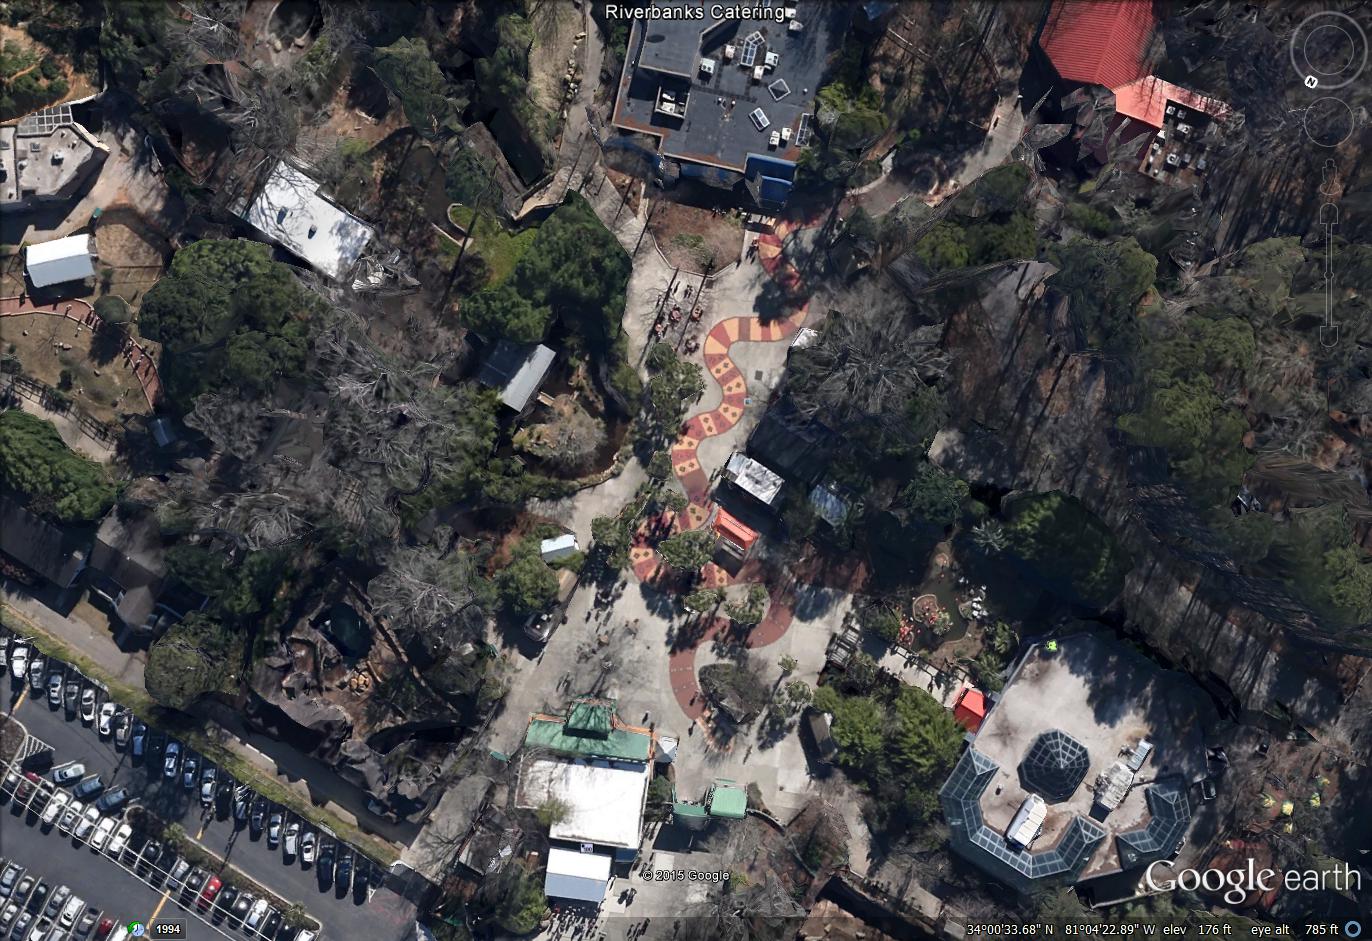
I then needed to get the lay of the land. I gathered any existing photos and imagery I could and even used Google Earth and Google Maps to get some idea of the aerial views of the park. Then I set out and gathered my own photos and videos of the zoo and garden areas.
I then needed to get the lay of the land. I gathered any existing photos and imagery I could and even used Google Earth and Google Maps to get some idea of the aerial views of the park. Then I set out and gathered my own photos and videos of the park.

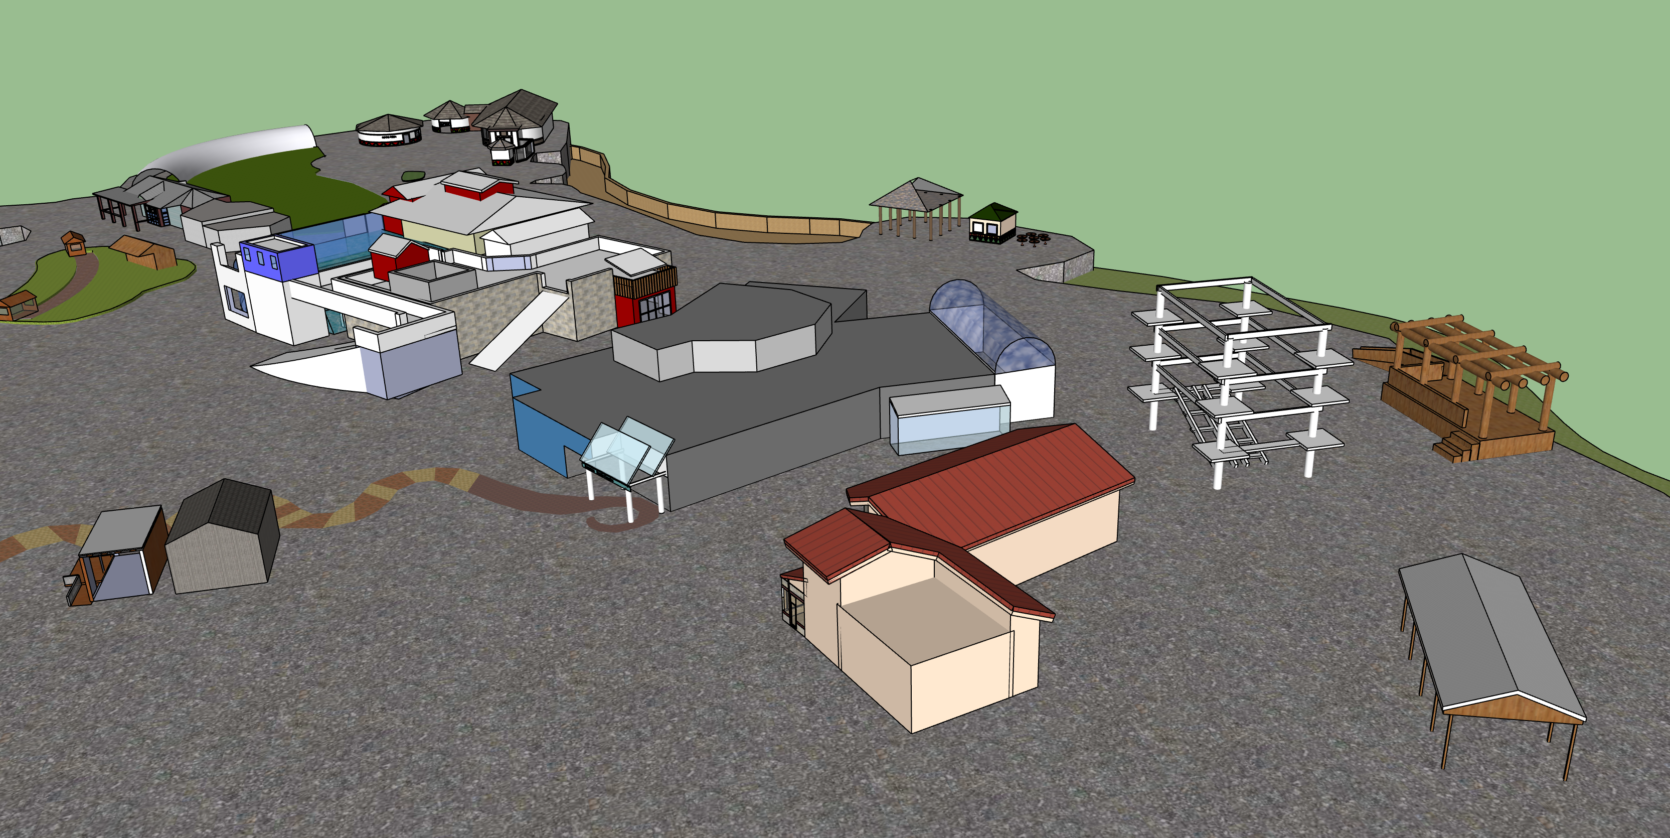
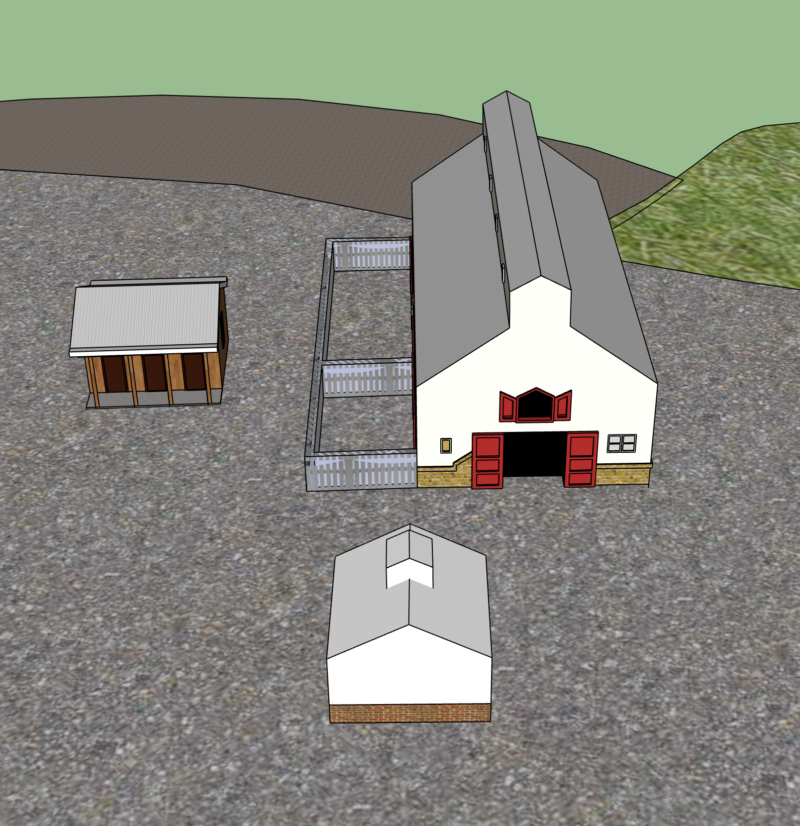
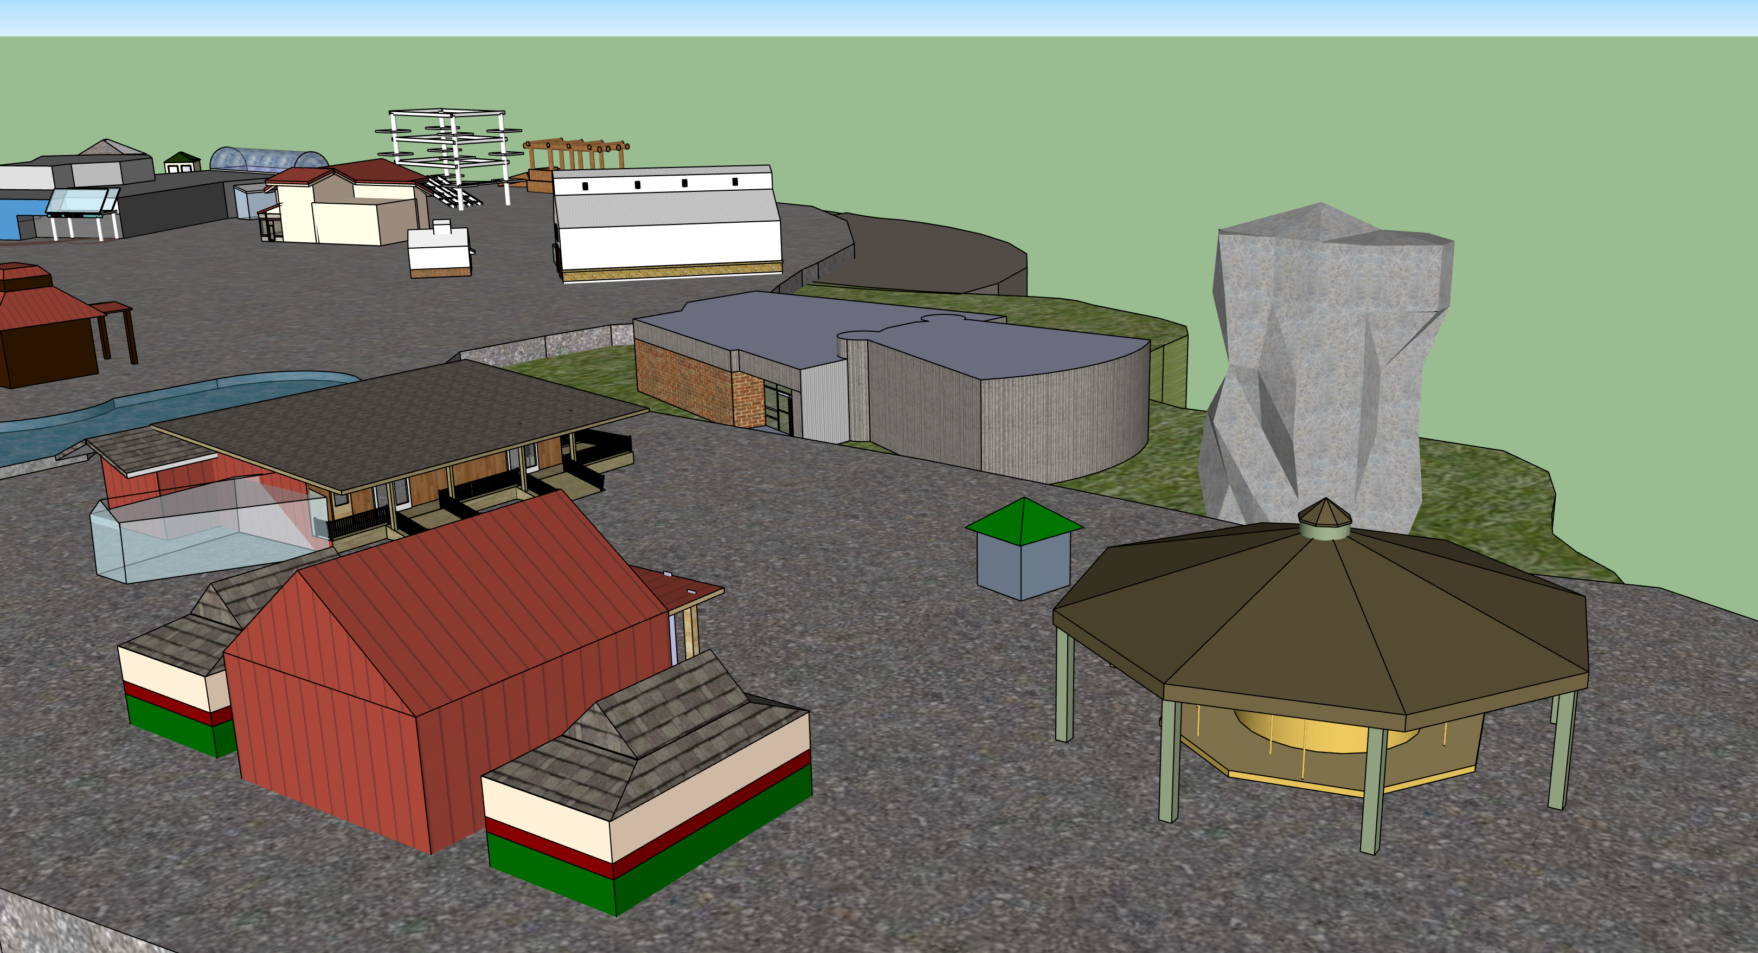
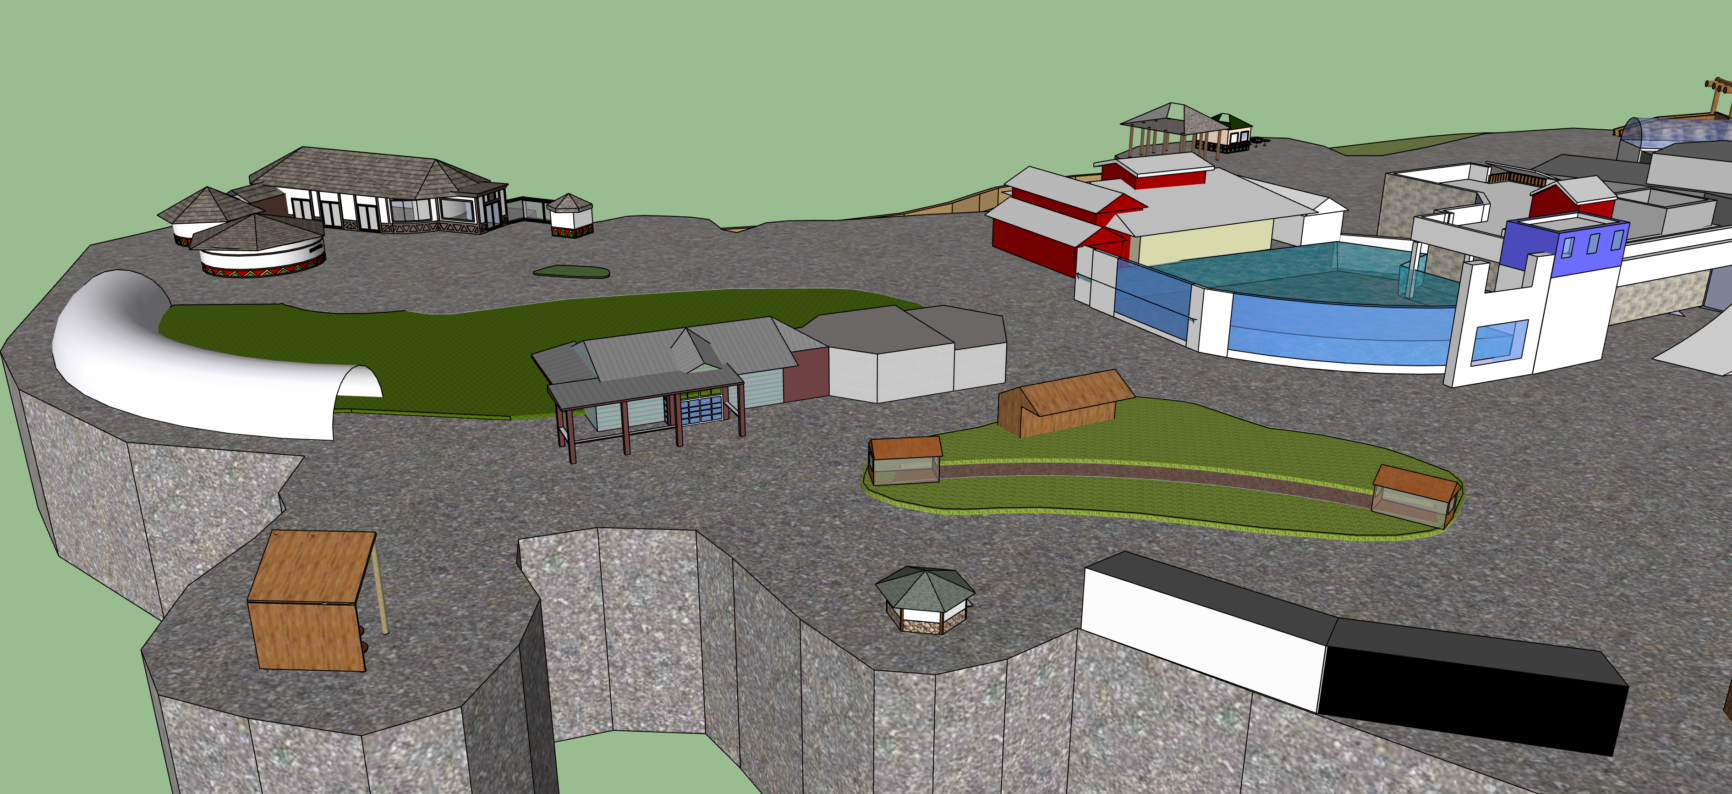
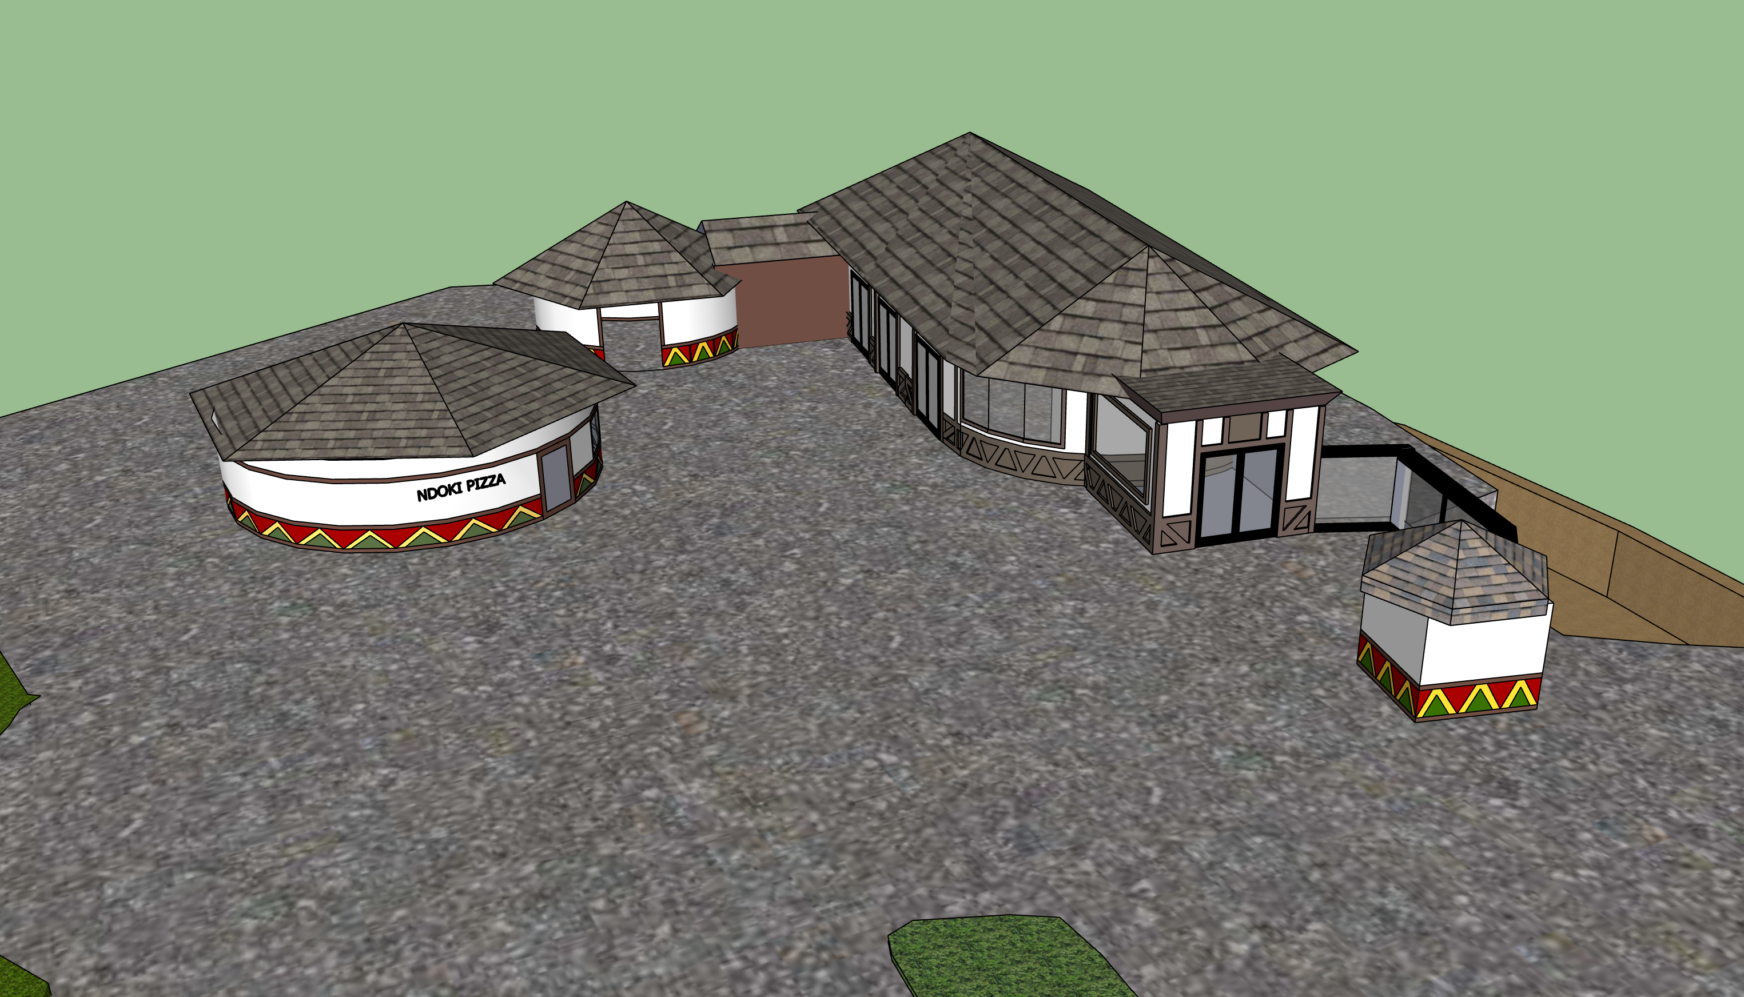
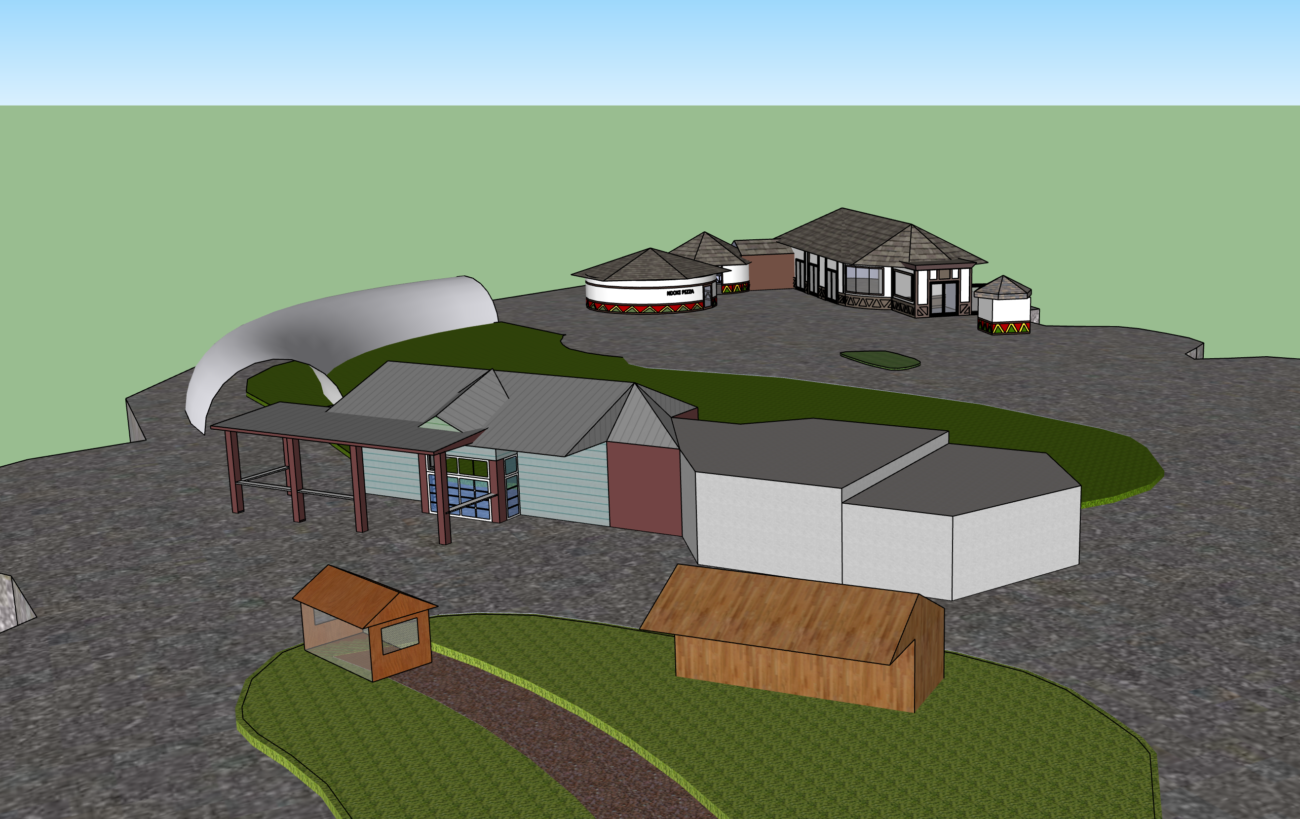
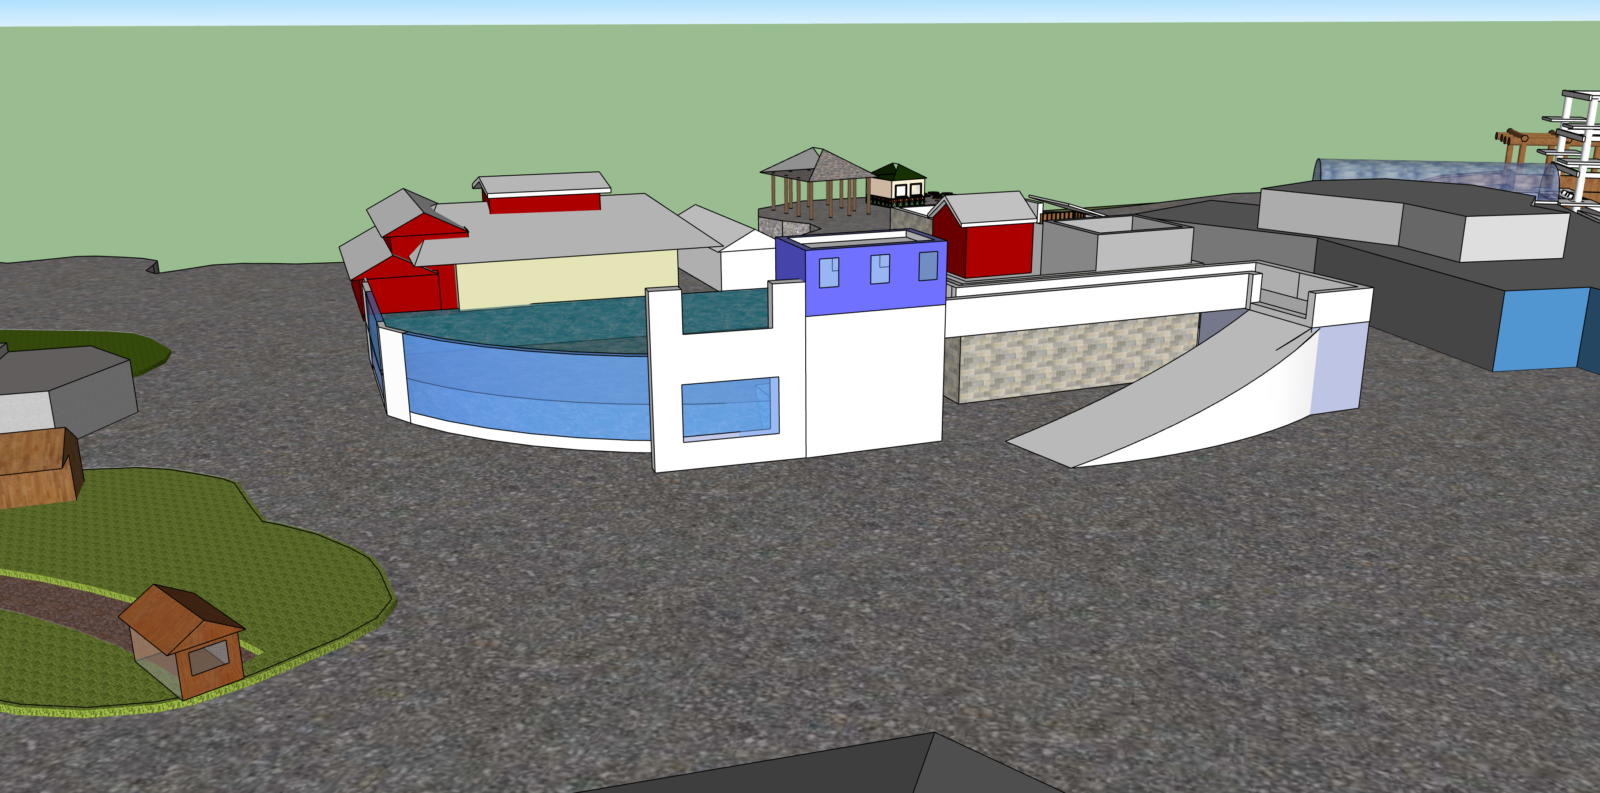
3. Create 3D Model
3. Create 3D Model
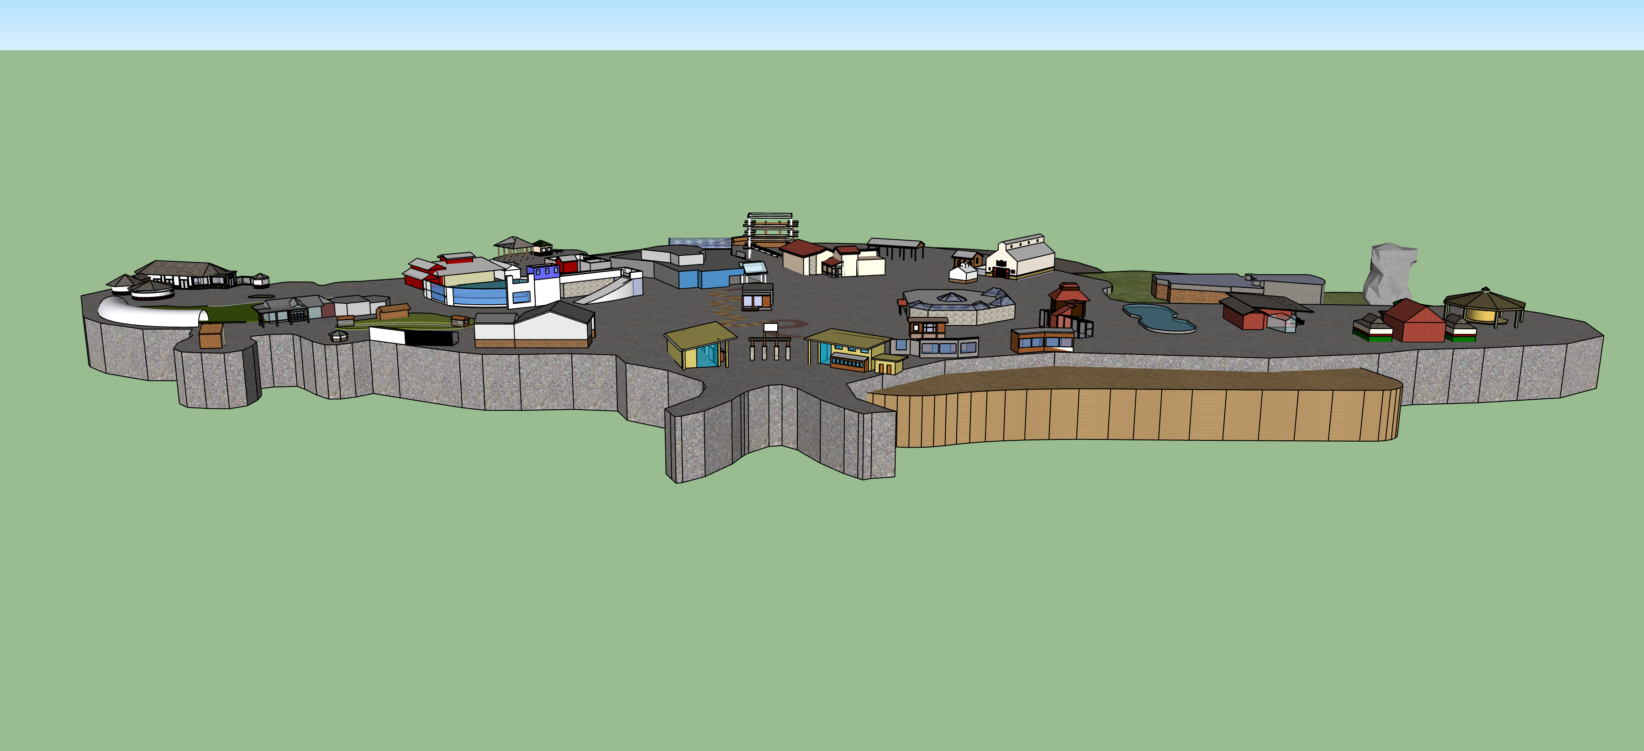
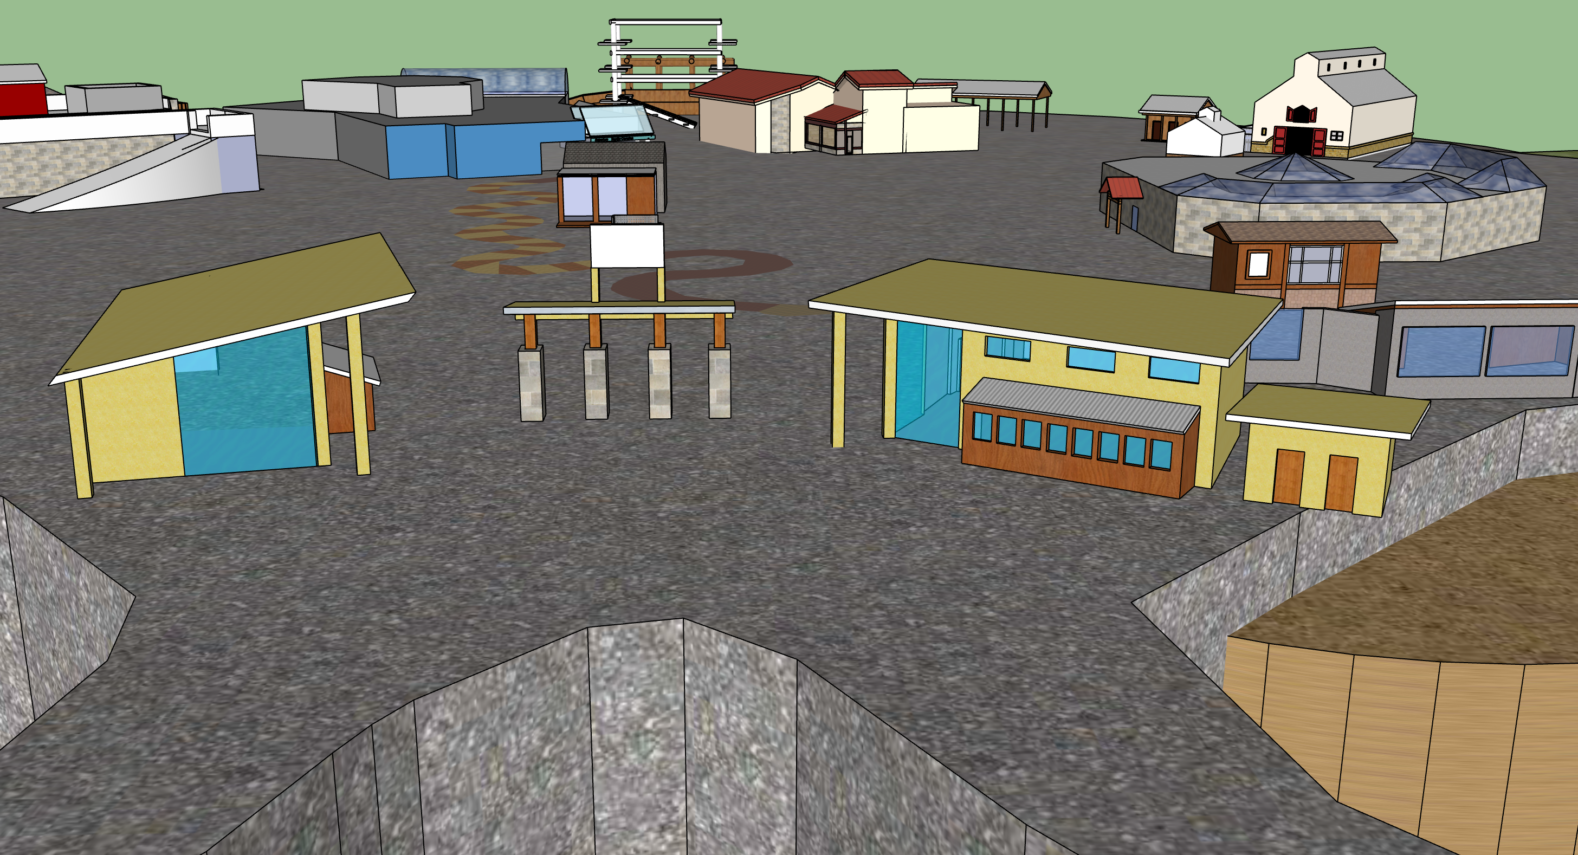
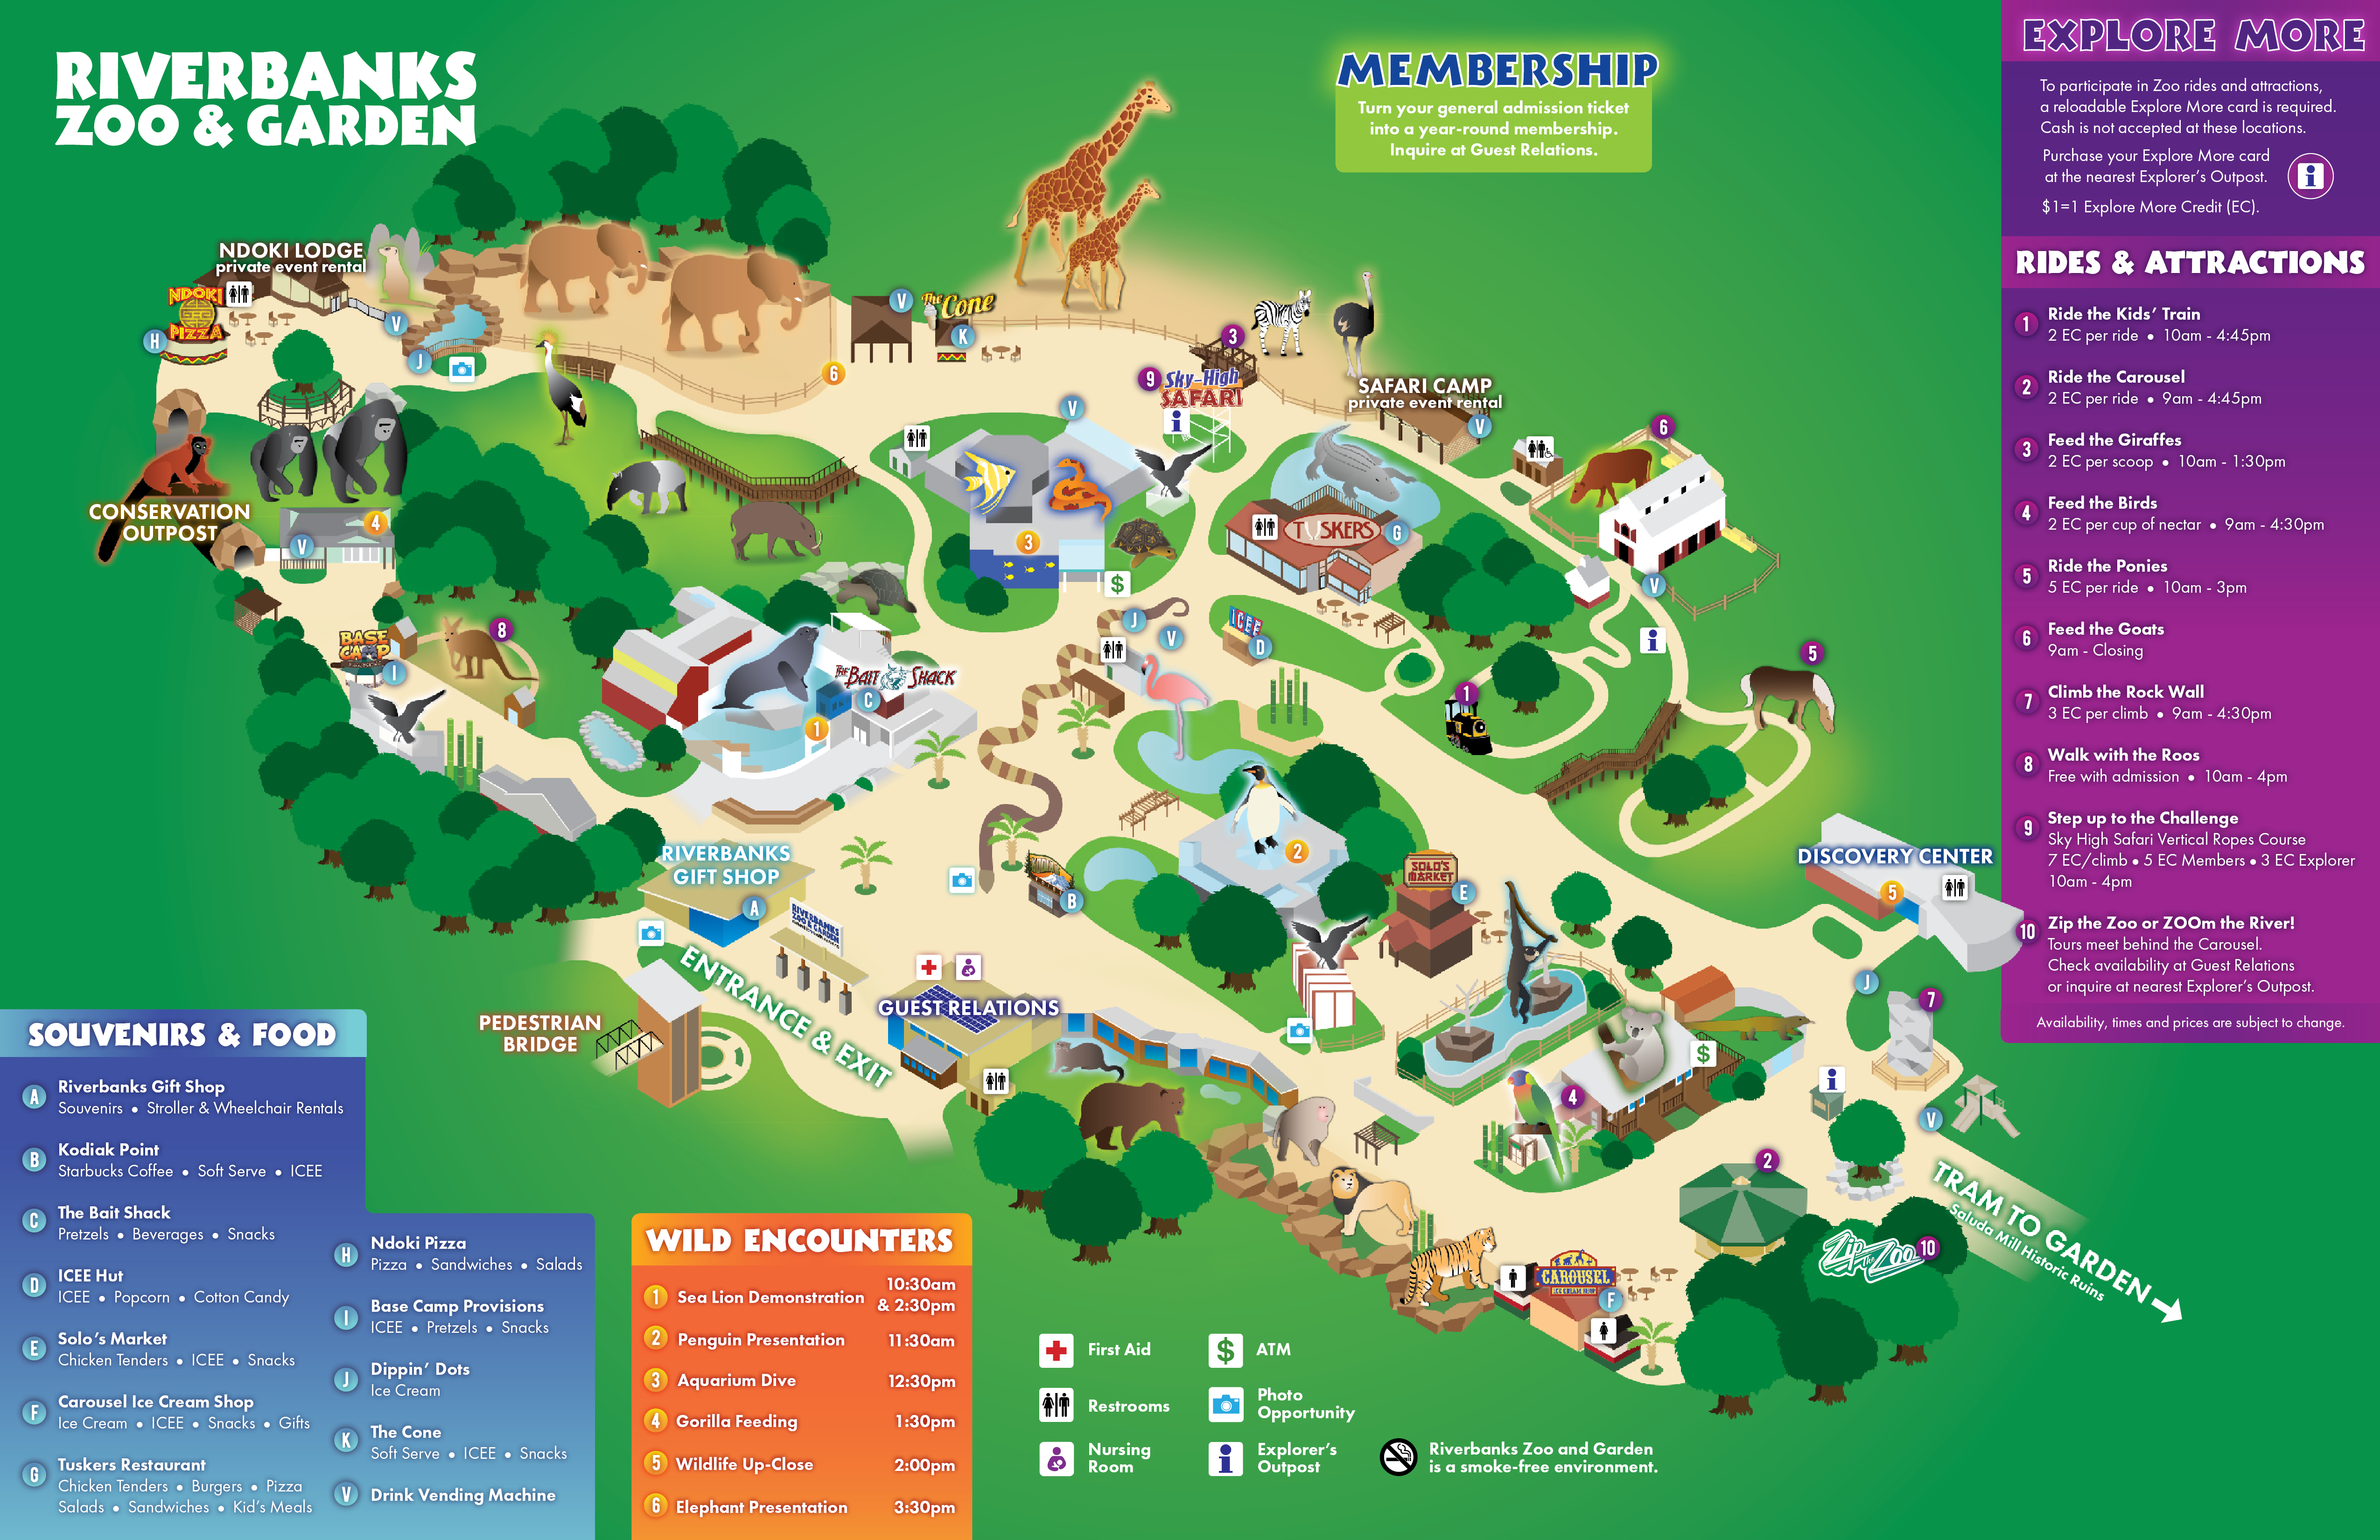
Then came the question, how do I use these photos to get the correct angle on every structure from the same perspective? After some thought and research, I decided I'd need to use a 3D building software, like the tools that architects use to draft mock-ups of buildings. So I found one, learned how to use it, and built the zoo with it. This way, I could decide what perspective would work best, and which parts of each structure would be visible from that perspective.
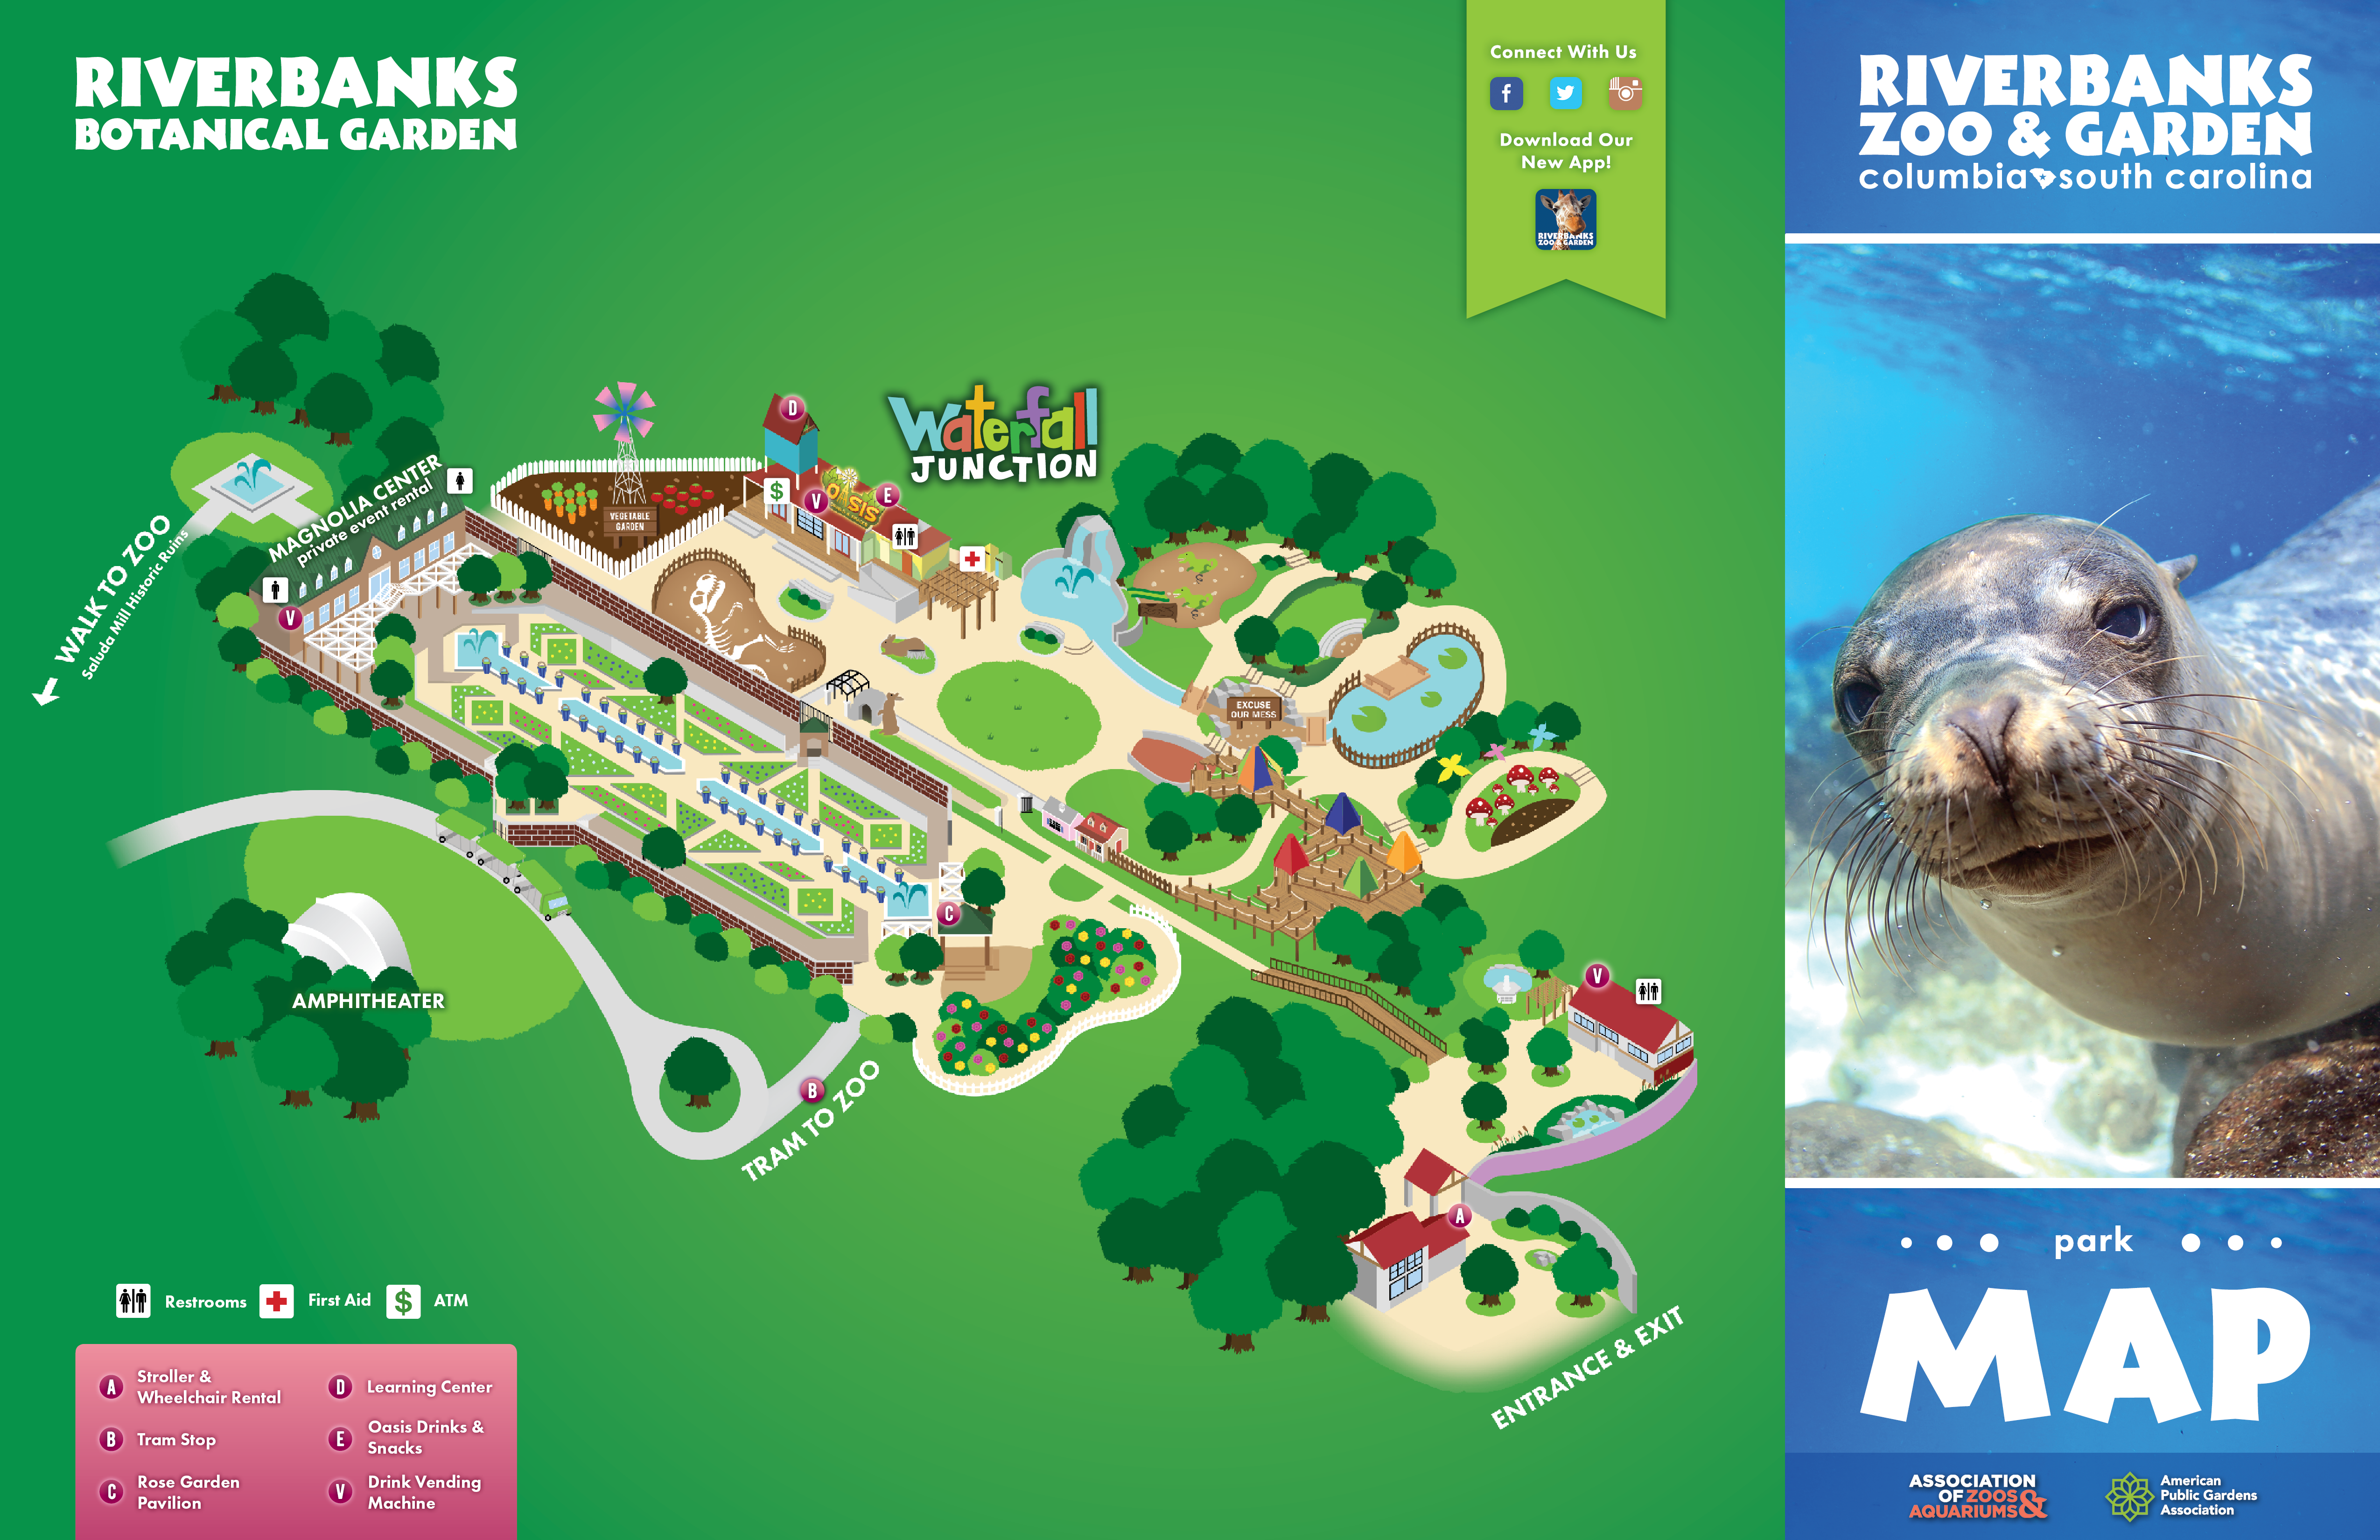
The perspective I chose pointed the entrances to the left side (for both the zoo and garden maps) of the page. Because people read left to right, having the entrance close to the left made the most sense as users start their journey through the zoo.


4. Illustrate
4. Illustrate
4. Illustrate
With that built, I was able to really tackle the isometric design. I determined my first step would be to create the vector illustrations. I used a grid to keep proportions in check as I worked on making buildings look three-dimensional.
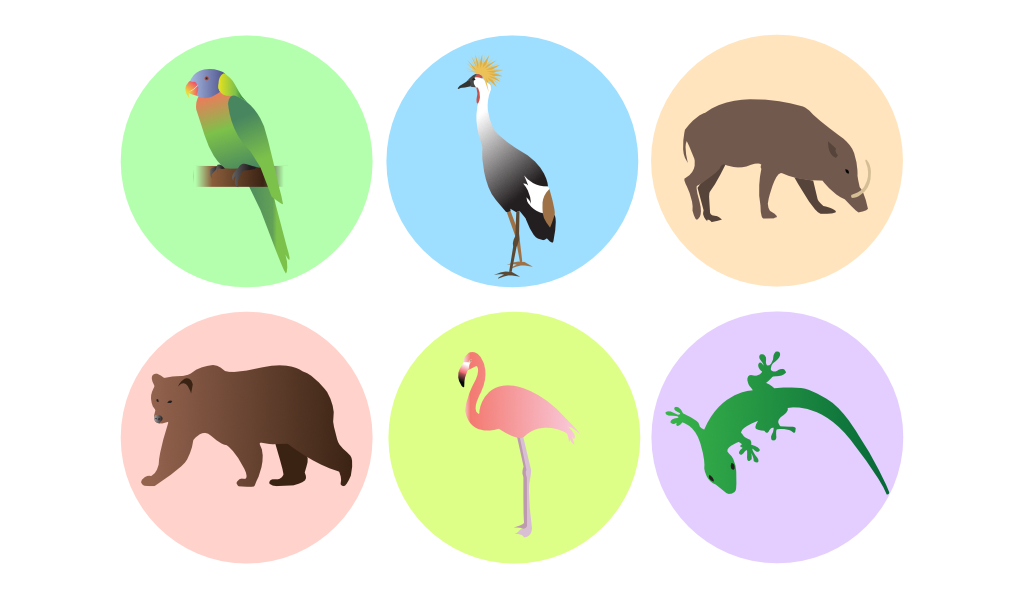
Because the animal illustrations were not isometric in design and because they needed to be styled individually, I created them separate from the map. I first designed them in Illustrator as vectors, then polished them in Photoshop to give them more dimension.
With that built, I was able to really tackle the isometric design. I determined my first step would be to create the vector illustrations. I used a grid to keep proportions in check as I worked on making buildings look three-dimensional.
Because the animal illustrations were not isometric in design and because they needed to be styled individually, I created them separate from the map. I first designed them in Illustrator as vectors, then polished them in Photoshop to give them more dimension.
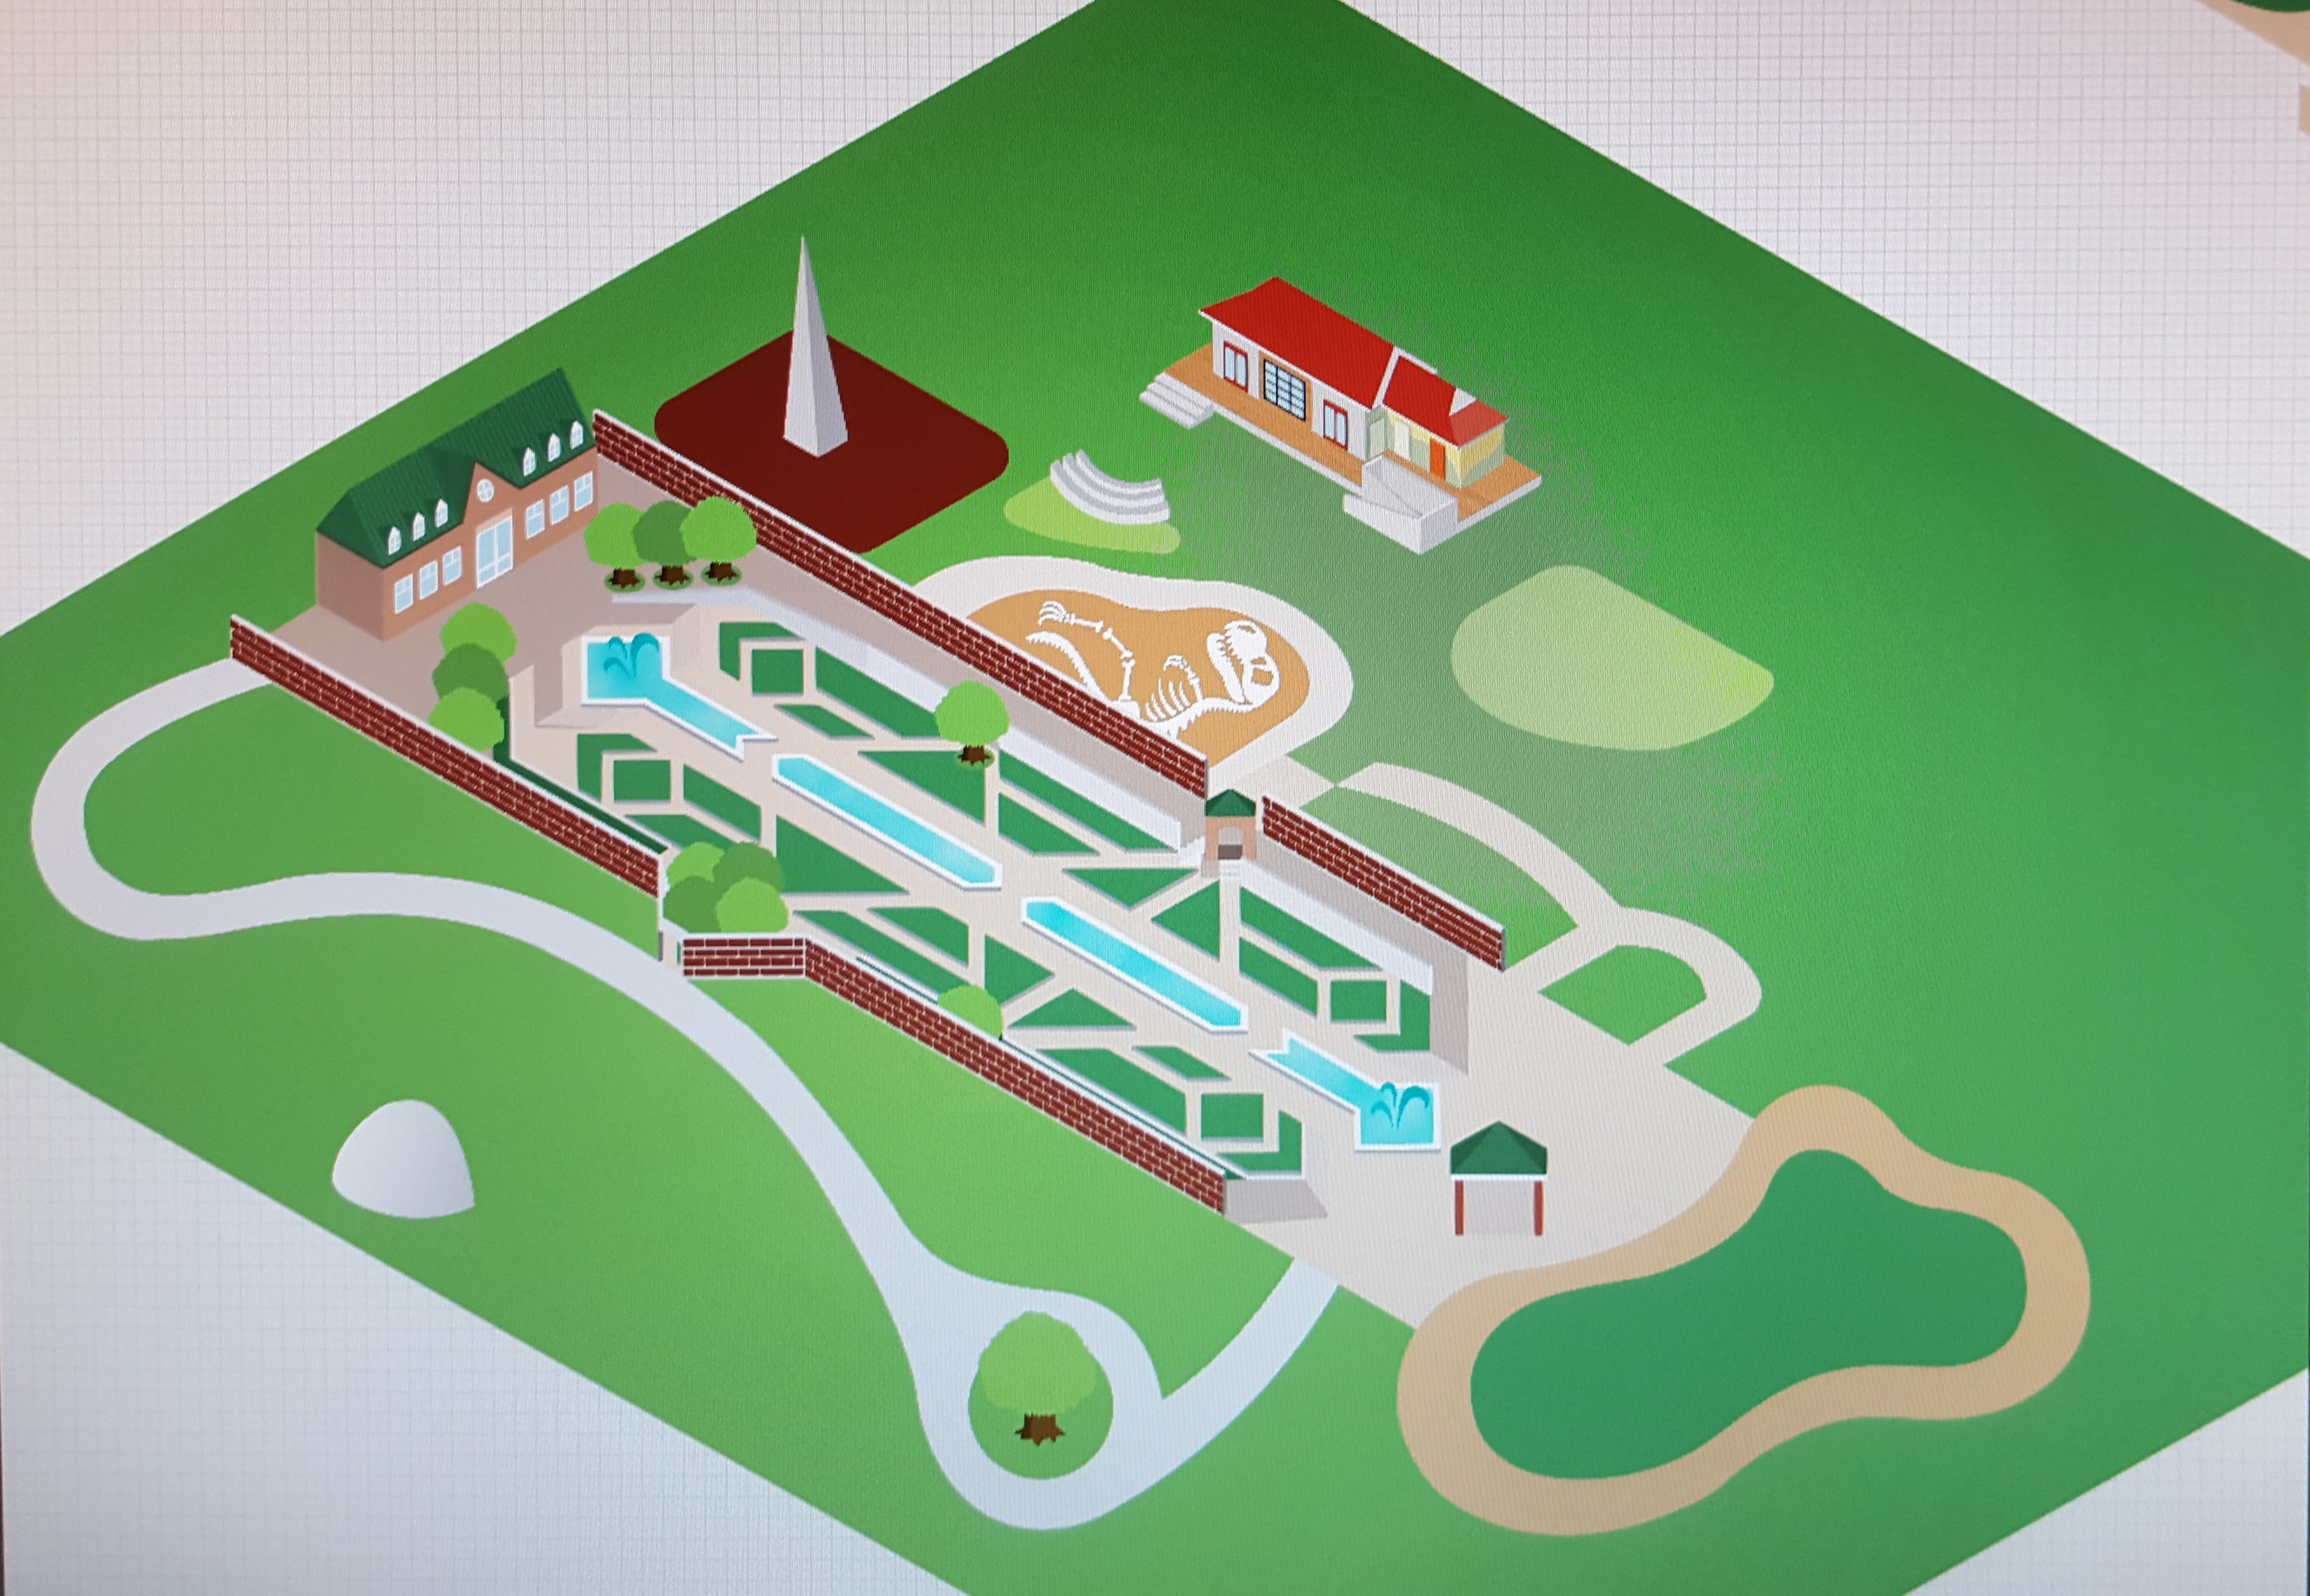
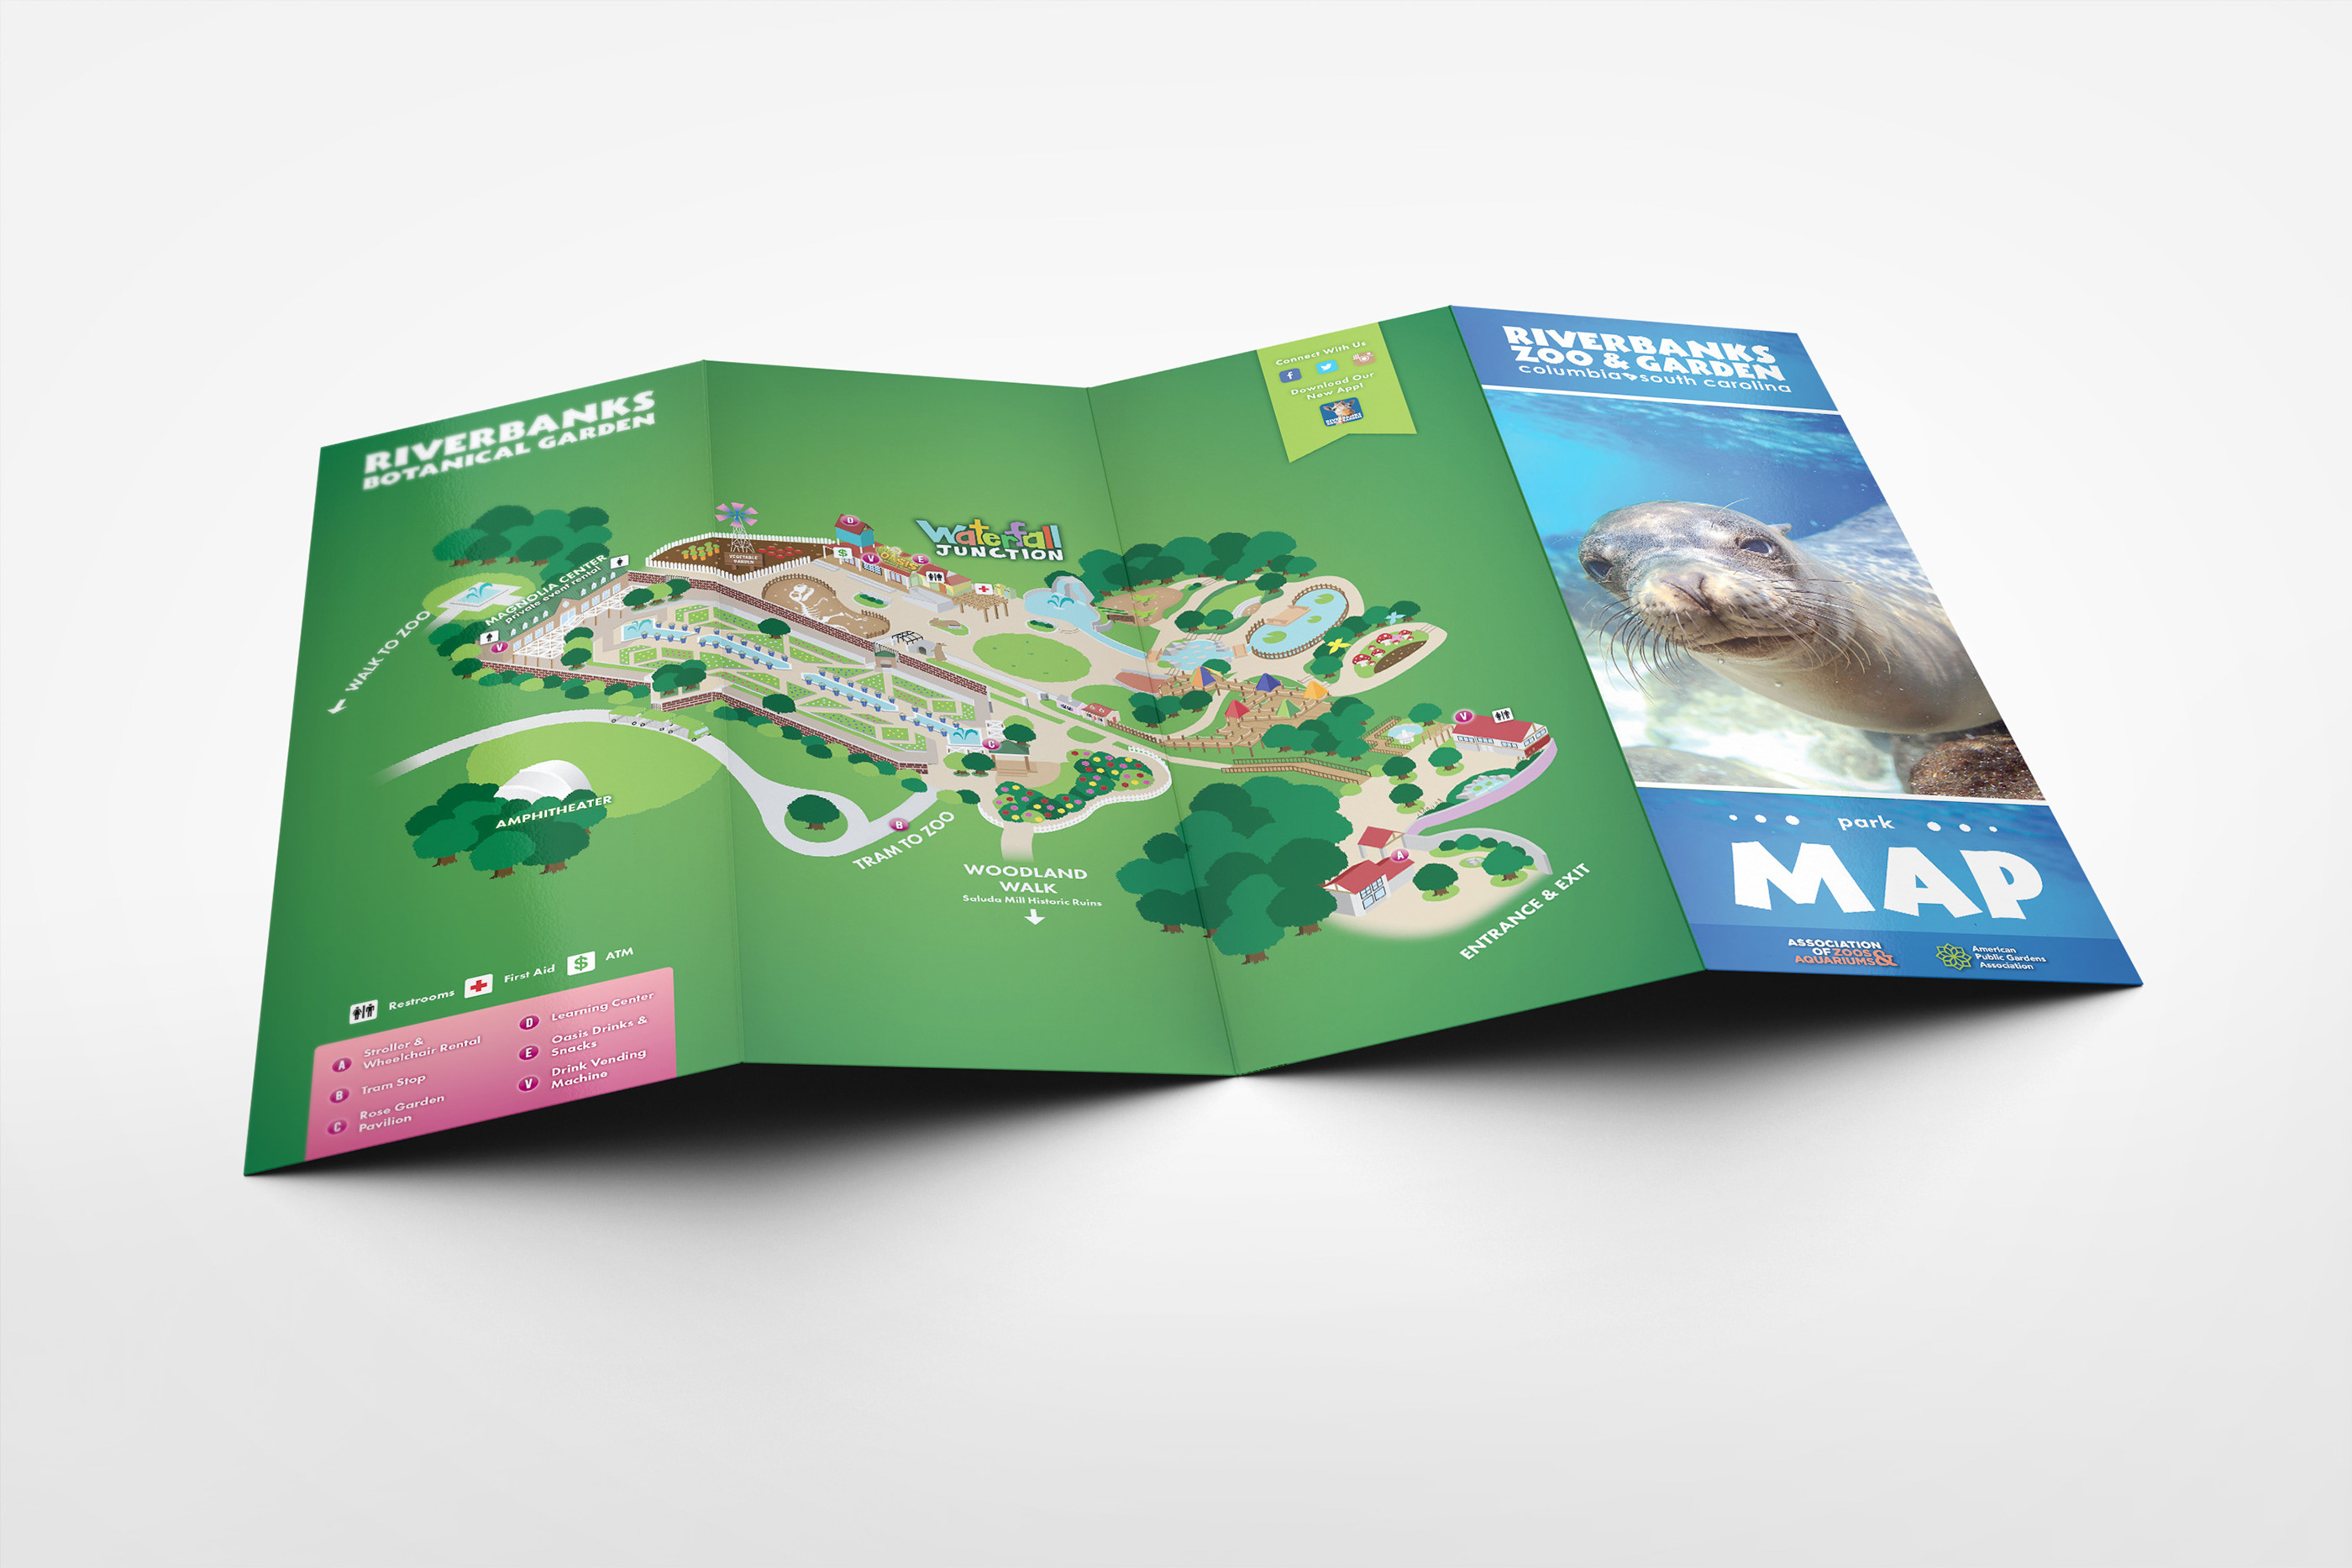
The garden side in progress. This side was really fun to design because the geometry of the botanical garden was so symmetrical.
5. Finalize
5. Finalize
Details, details, details.
Details, details, details.
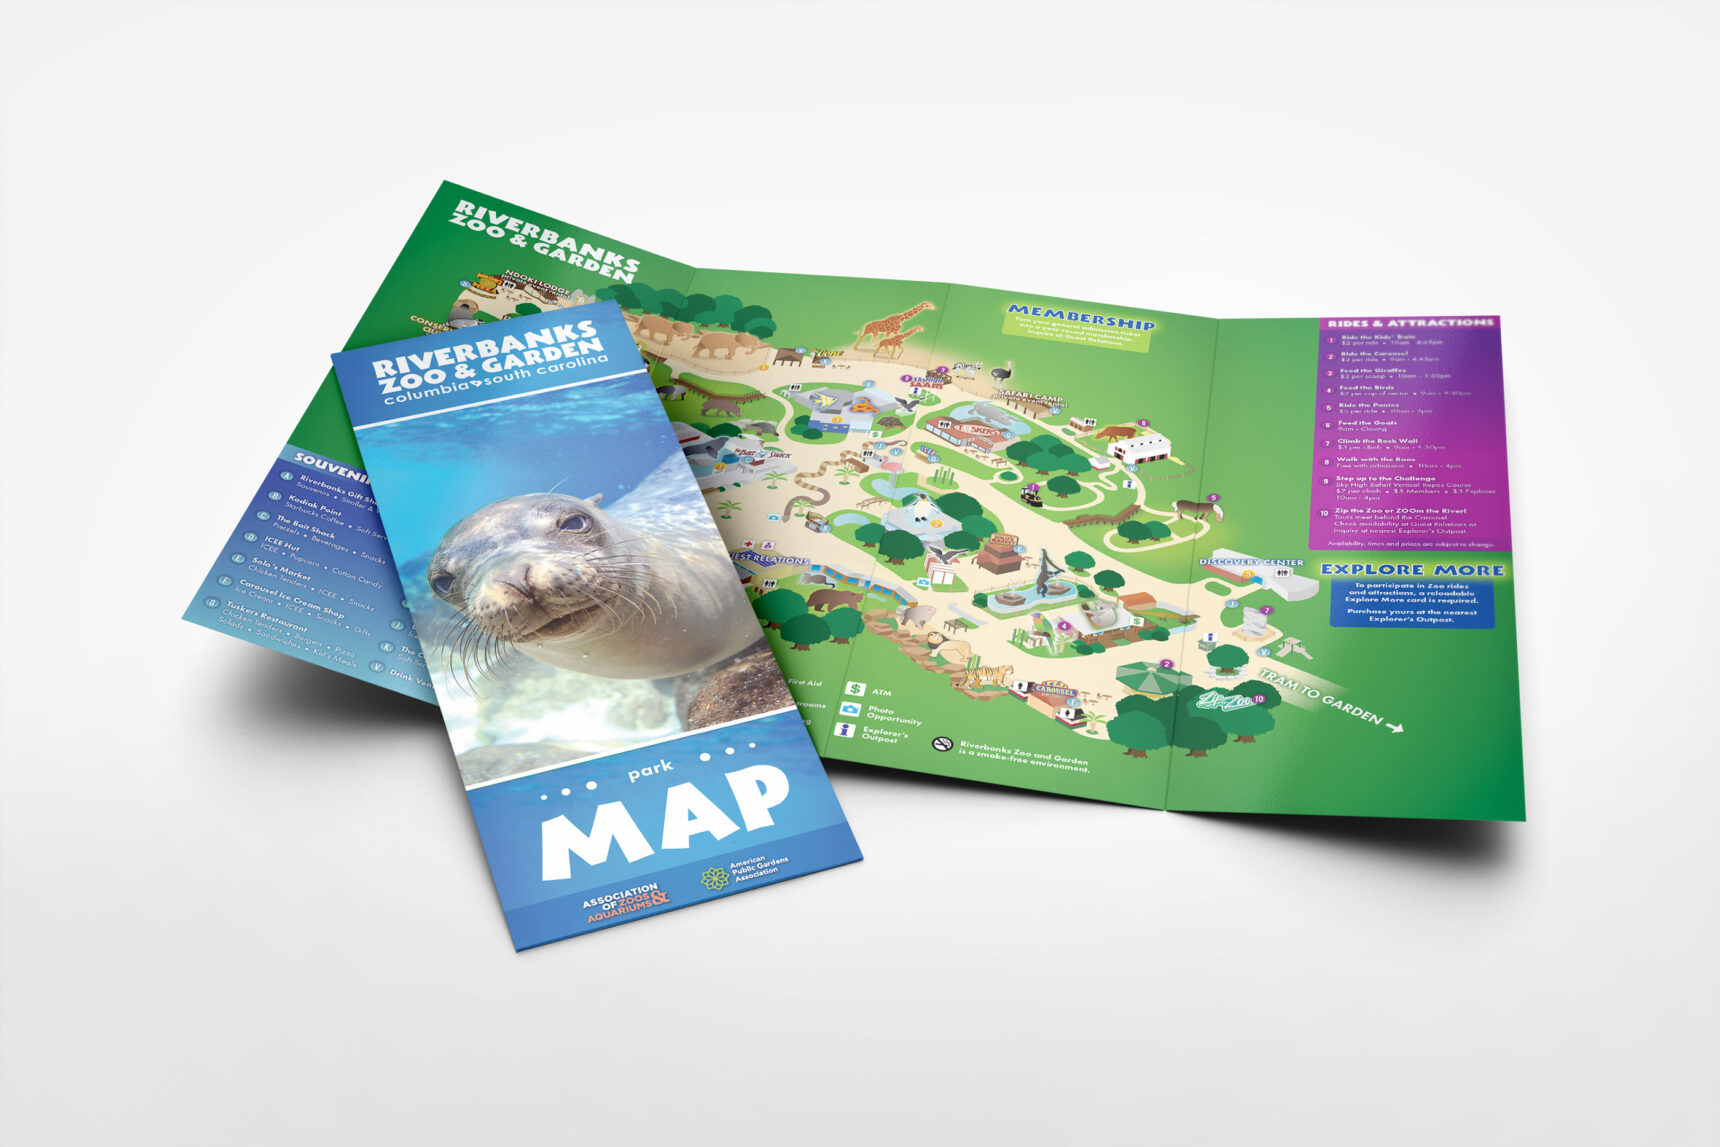
One of the final parts I added to the map were the colorful tabs containing important information about buildings and event offerings. Because these details were subject to change, I needed to make them easily editable. So I imported the base map file into InDesign, where the text editing process would be the most straight-forward out of any of the software I had access to. There would be no risk of changing the map itself.
In InDesign is where I added each tab of necessary information grouped by type of info (Souvenirs & Food, Wild Encounters, and Rides & Attractions). I color-coded the tabs to be paired with their respective markers, choosing to use three very distinct color sets to help visitors quickly and easily be able to differentiate between the types of information they were looking at. I also chose colors that were both vibrant and deep, and gave the tabs some dimension by using gradients.
When it came to size, because of how full the map was of different components, I opted for a larger size (11" x 17"). After many tests at different sizes, this size made each part clear and identifiable, while also leaving room for the extra information at a readable size.
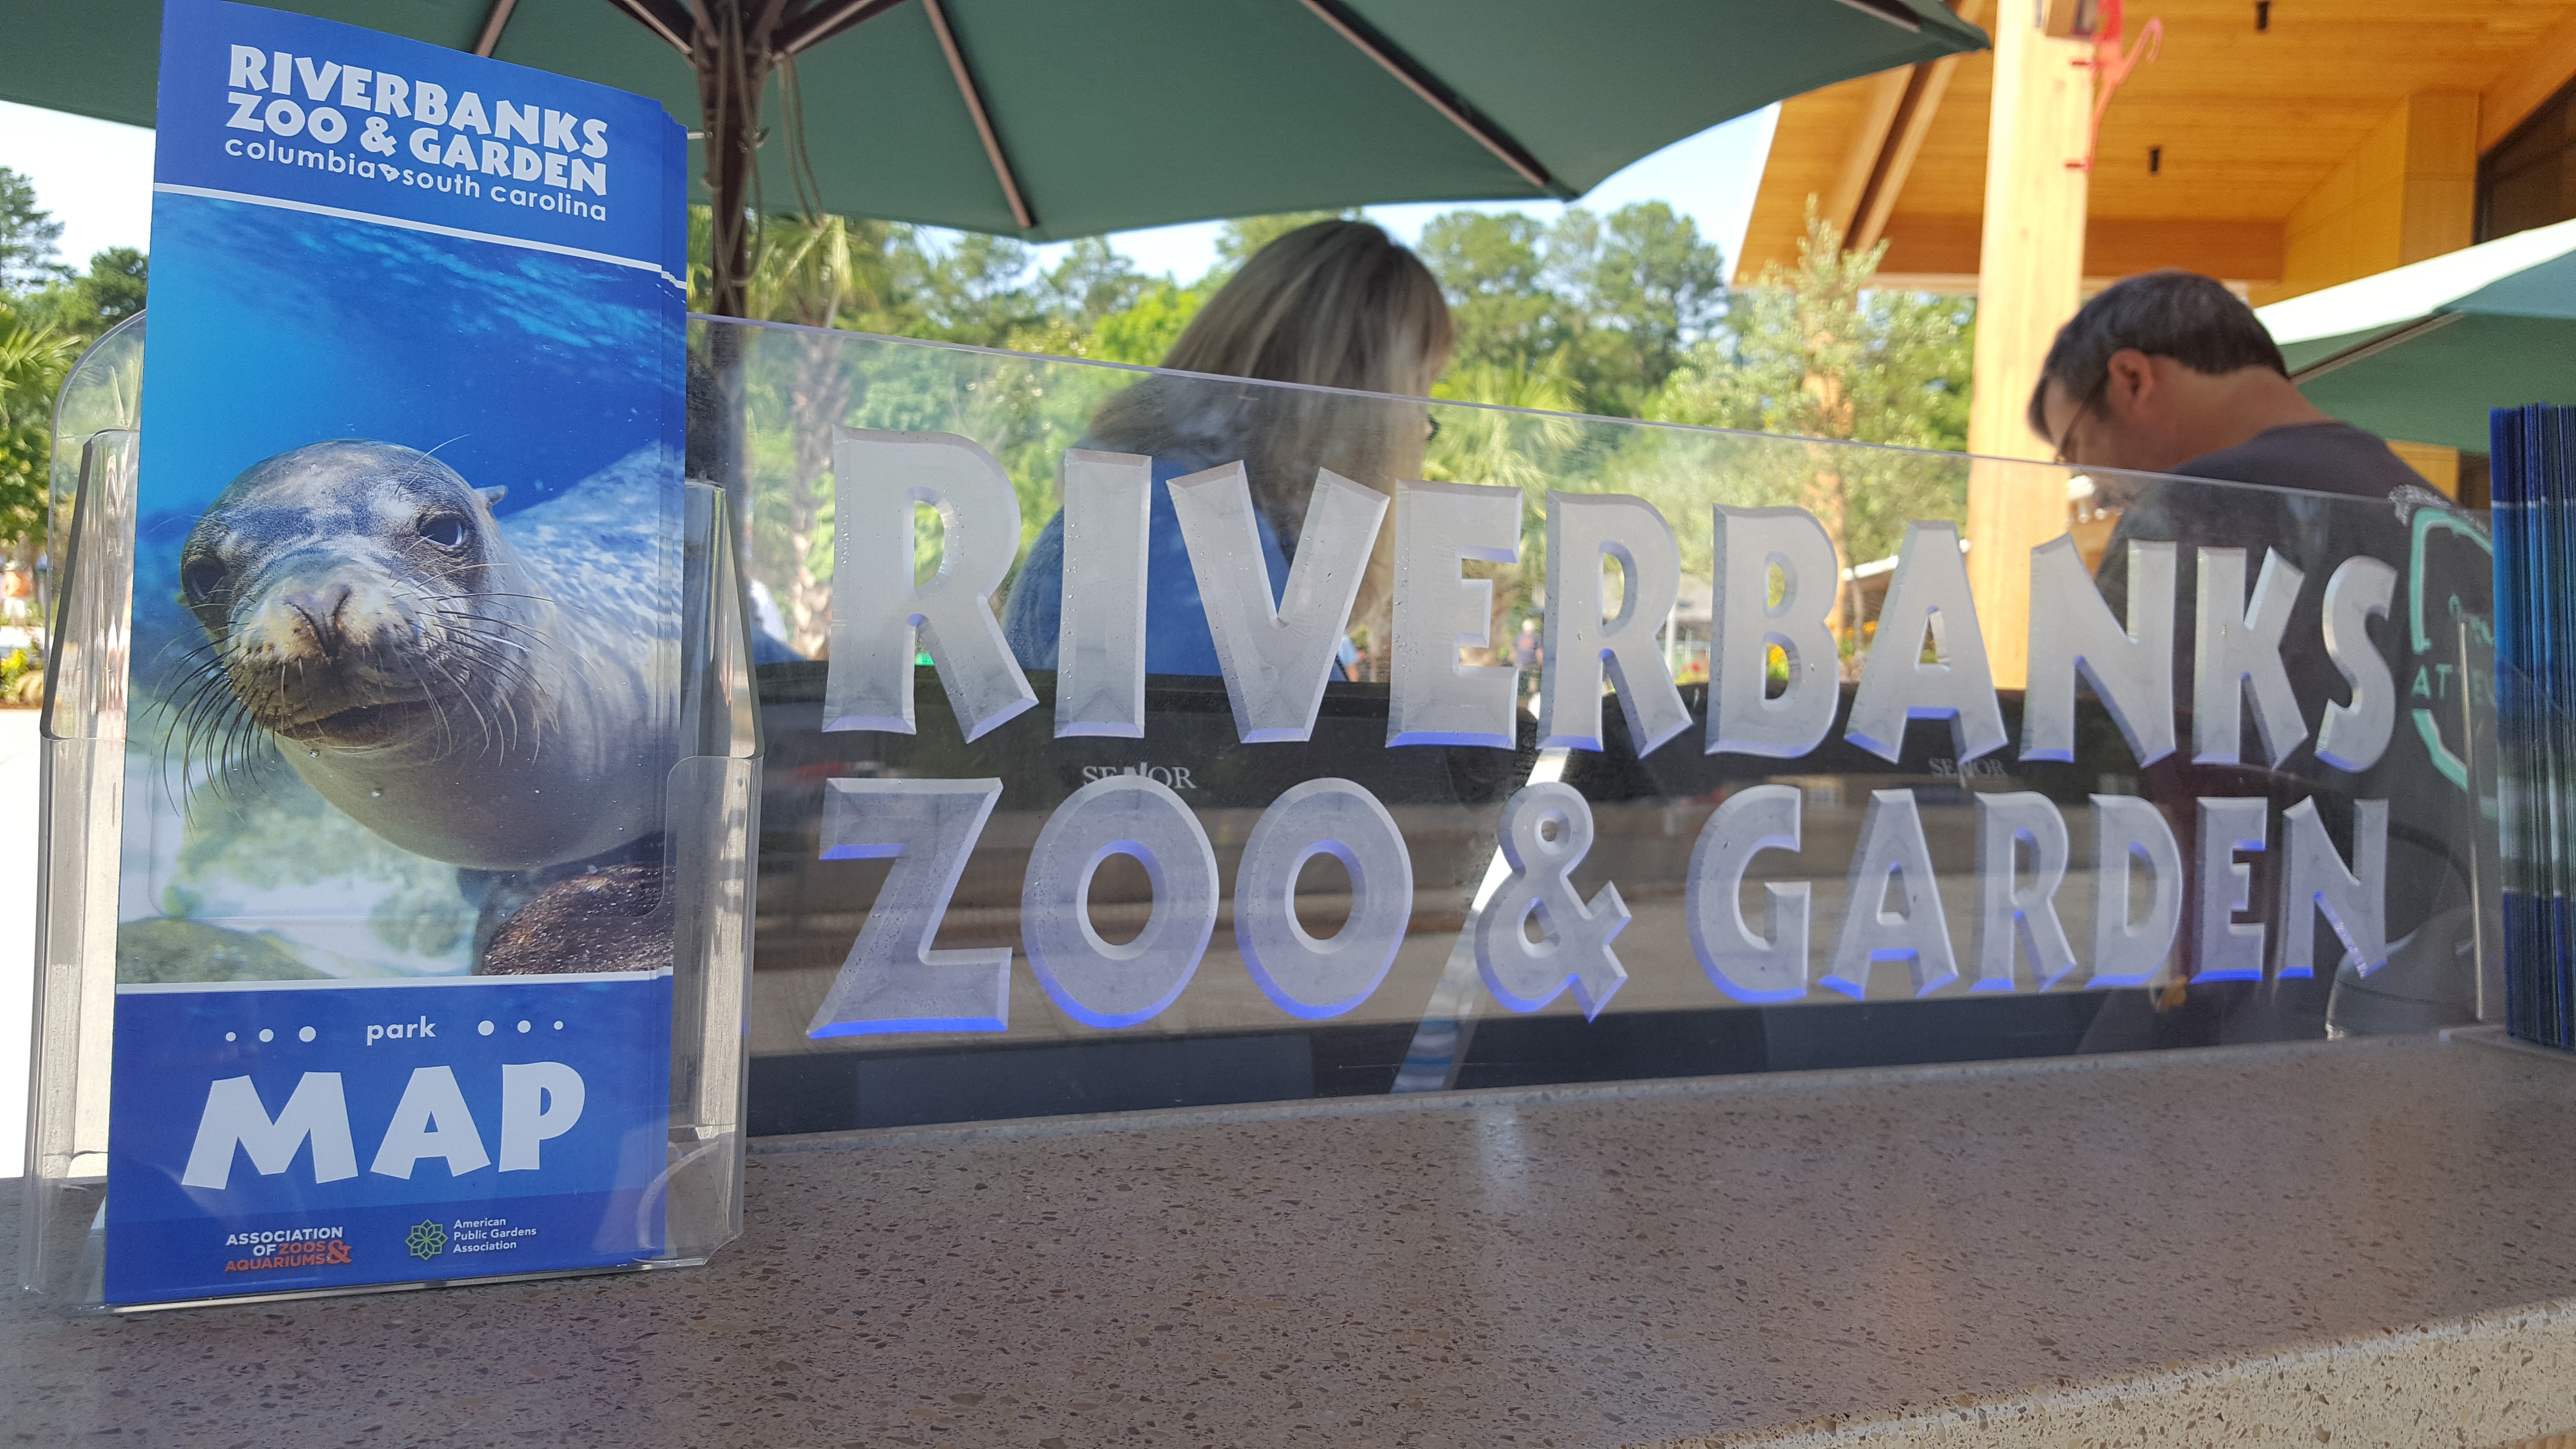
The image for the front fold of the map was also strategic, because at the time the seal and sea lion exhibit had just been built. So I took that opportunity to highlight the opening of one of the largest new exhibits.
Overall, this was one of my most challenging projects. It required a lot of planning, research, and iteration, but it was a great learning experience and it also had a huge payoff. I got to create something that would be widely used and add to the fun experience of visiting the park.